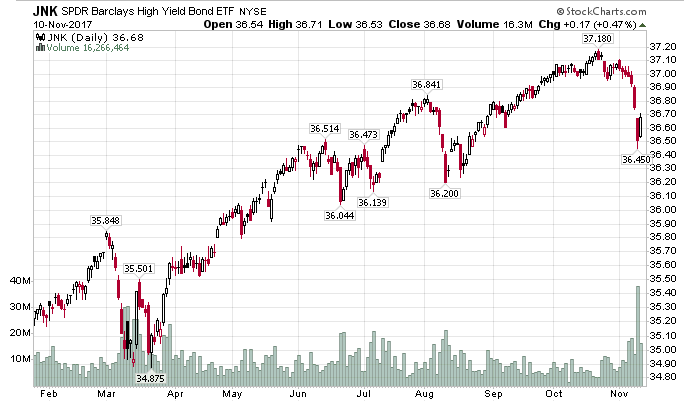
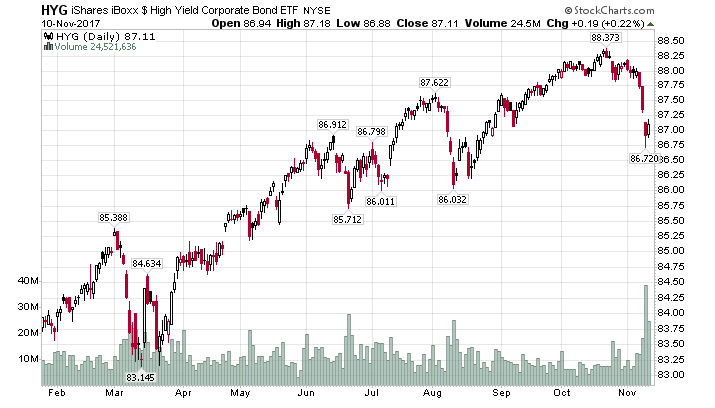
Volatility has returned, at least in the junk bond market. SPDR Barclays (LON:BARC) High Yield Bond (NYSE:JNK), and iShares iBoxx $ High Yield Corporate Bond (NYSE:HYG) both had the steepest decline in three months. Is this another buy the dip opportunity or is risk avoidance about to take hold?
Cracks Widen
Reuters reports U.S.Junk Bond Sector Ends Rough Week On Calmer Note.
Cracks in the red-hot U.S. high-yield bond market are starting to widen, with two junk-rated companies pulling their deals on Friday and U.S.-based high-yield funds suffering their second consecutive week of cash withdrawals.
“Folks have become super negative on risk all of a sudden,” said Greg Peters, managing director and senior portfolio manager at PGIM Fixed Income.
On Friday, coal producer Canyon Consolidated Resources became the second junk-rated company to pull a bond sale this week amid a bout of volatility in credit markets. NRG Energy (NYSE:NRG) pulled its junk bond offering on Thursday as spreads across the asset class widened sharply and the two main junk bond ETFs reached seven-month lows.
Bank of America Corp (NYSE:BAC) analysts said in a note on Friday that volatility in high-yield has been “driven primarily by a confluence of several meaningful and yet only loosely related events,” including the collapse of the Sprint Corp (NYSE:S) and T-Mobile US Inc (NASDAQ:TMUS) merger, the U.S. Justice Department’s challenges to the AT&T Inc (NYSE:T) and Time Warner Inc (NYSE:TWX) merger, a credit downgrade for Teva Pharmaceutical Industries (NYSE:TEVA) Ltd and other industry-specific news along with the potential for tax reform to be delayed.
The analysts also said the flatness of the yield curve has been hurting high yield, partly by hurting bank stocks, which benefit from a steeper yield curve that allows them to borrow cheaply, lend at higher rates and profit from the difference.
JNK Daily
HYG Daily
Another Dip Buying Opportunity?
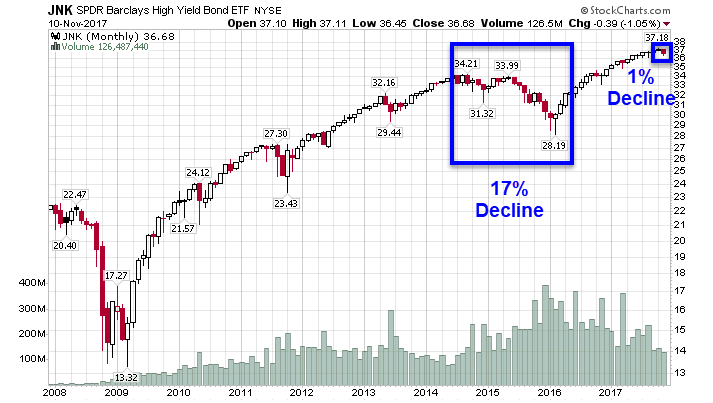
The declines look meaningful, but if you crunch the numbers, the total decline over the past two weeks is just over one percent. Monthly charts make it appear as if nothing happened at all.
JNK Monthly
HYG Monthly
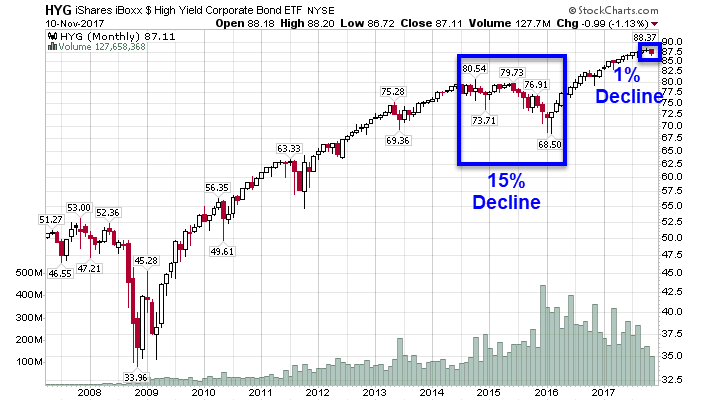
On a monthly basis, it's hard to label these moves as "dips". Then again are things expected to rise forever?
Yield Curve
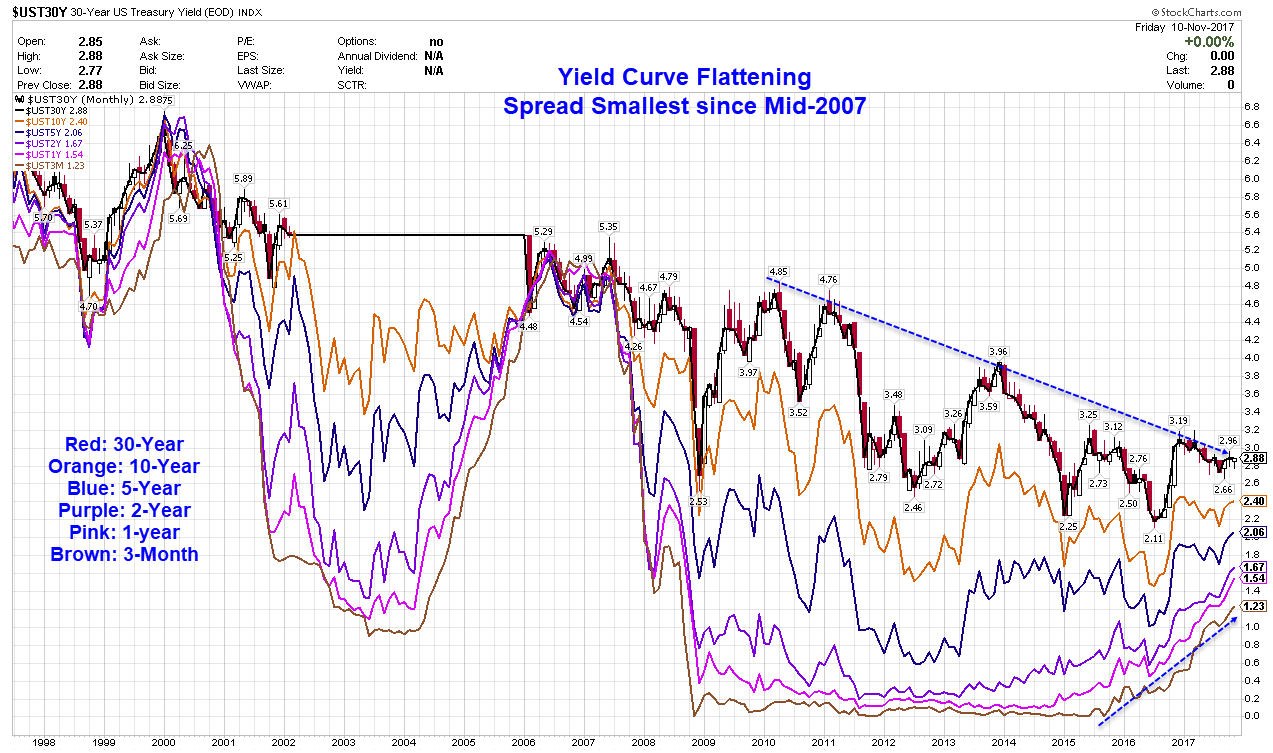
Analysts stated "flatness of the yield curve has been hurting high yield."
Starting mid-2016, the ETFs rose 20 out of 23 months with the yield curve flattening throughout 2017.
Volatility Not Started
Volatility has not yet started, despite claims to the contrary.
Is this the start of a meaningful decline?
I do not know, nor does anyone else. But I do suspect that cracks will appear first in the credit markets.
