
The Weekly VC Price Momentum Indicator
ETF’s, Futures Swing Trading Instructions weekly 8.11 .17
Signals are automatically generated by integrating electronic prices and weekly statistics with proprietary algorithms.
WEEKLY SUMMARY
TREND MOMENTUM: 46.64 Bullish
PRICE MOMENTUM: 49 Bearish
PRICE INDICATOR
EXIT LONG:
S2) 51.25
S1) 50.03
EXIT SHORTS:
B1) 47.79
B2) 46.77
WEEKLY TREND MOMENTUM
The contract closed at 48.82 The market closing above the 9 SMA 46.64 is confirmation that the trend momentum is bullish. A close below the 9 SMA would negate the weekly bullish short-term trend to neutral.
WEEKLY PRICE MOMENTUM
With the market closing below The VC Weekly Price Momentum Indicator of 49,00 it confirms that the price momentum is bearish. A close above the VC Weekly, it would negate the bearish signal to neutral.
WEEKLY PRICE INDICATOR
Cover short on corrections at the 47.79 - 46.77 levels and go long on a weekly reversal stop. If long, use the 46.77 level as a Stop Close Only and Good Till Cancelled order. Look to take some profits on longs, as we reach the 50.03 - 51.25 levels during the week.

WEEKLY SUMMARY
TREND MOMENTUM: 2450 Bullish
PRICE MOMENTUM: 2474 Bearish
PRICE INDICATOR
EXIT LONGS:
2) 2504
1) 2488
EXIT SHORTS:
1) 2458
2) 2444
WEEKLY TREND MOMENTUM
The contract closed at 2440. The market closing below the 9 SMA 2446 is confirmation that the trend momentum is bearish. A close above the 9 SMA would negate the weekly bearish short-term trend to neutral.
WEEKLY PRICE MOMENTUM
With the market closing below The VC Weekly Price Momentum Indicator of 2453 it confirms that the price momentum is bearish. A close above the VC Weekly, it would negate the bearish signal to neutral.
WEEKLY PRICE INDICATOR
Cover short on corrections at the 2417 - 2394 levels and go long on a weekly reversal stop. If long, use the 2394 level as a Stop Close Only and Good Till Cancelled order. Look to take some profits on longs, as we reach the 2476 - 2512 levels during the week.

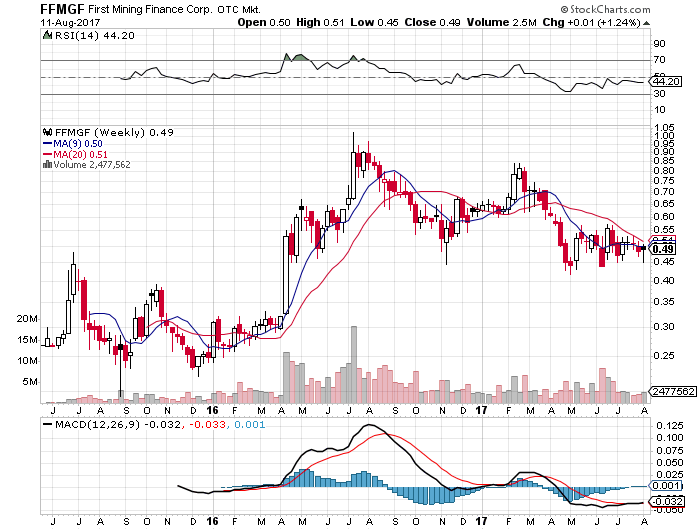
First Mining Finance Corp (TO:FF)
WEEKLY SUMMARY
TREND MOMENTUM: 0.50 Bearish
PRICE MOMENTUM: 0.47 Bearish
PRICE INDICATOR
EXIT LONGS:
S2) 0.53
S1) 0.49
EXIT SHORTS
B1) 0.43
B2) 0.41
WEEKLY TREND MOMENTUM
The contract closed at 0.45. The market closing below the 9 SMA 0.50 is confirmation that the trend momentum is bearish. A close above the 9 SMA would negate the weekly bearish short-term trend to neutral.
WEEKLY PRICE MOMENTUM
With the market closing below The VC Weekly Price Momentum Indicator of 0.47 it confirms that the price momentum is bearish. A close above the VC Weekly, it would negate the bearish signal to neutral.
WEEKLY PRICE INDICATOR
Cover short on corrections at the 0.43 - 0.41 levels and go long on a weekly reversal stop. If long, use the 0.41 level as a Stop Close Only and Good Till Cancelled order. Look to take some profits on longs, as we reach the 0.49 - 0.53 levels during the week.
McEwen Mining Inc. (TO:MUX)
WEEKLY SUMMARY
TREND MOMENTUM: 2.56 Bullish
PRICE MOMENTUM: 2.31 Bullish
PRICE INDICATOR
EXIT LONGS:
S2) 2.56
S1) 2.48
EXIT SHOTS
B1) 2.23
B2) 2.06
WEEKLY TREND MOMENTUM
The contract closed at 2.39 The market closing above the 9 SMA 2.56 is confirmation that the trend is bullish. A close below the 9 SMA would negate the weekly bullish short-term trend to neutral.
WEEKLY PRICE MOMENTUM
With the market closing above The VC Weekly Price Momentum Indicator of 2.31 it confirms that the price momentum is bullish. A close below the VC Weekly, it would negate the bullish signal to neutral.
WEEKLY PRICE INDICATOR
Cover short on corrections at the 2.23 - 2.06 levels and go long on a weekly reversal stop. If long, use the 2.06 level as a Stop Close Only and Good Till Cancelled order. Look to take some profits on longs, as we reach the 2.48 - 2.56 levels during the week.

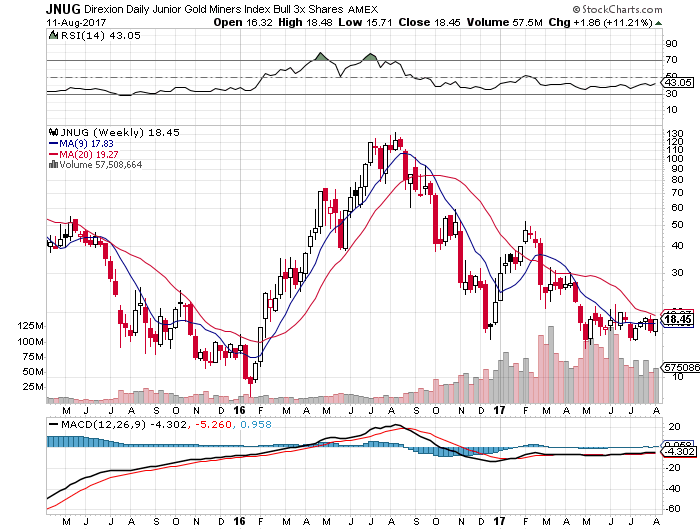
Direxion Daily Junior Gold Miners Bull 3X Shares (NYSE:JNUG)
WEEKLY SUMMARY
TREND MOMENTUM: 17.83 Bullish
PRICE MOMENTUM: 16.55 Bullish
PRICE INDICATOR
EXIT LONGS:
2) 20.32
1) 19.38
EXIT SHORTS:
16.61
14.78
WEEKLY TREND MOMENTUM
The contract closed at 18.45. The market closing above the 9 SMA 17.83 is confirmation that the trend momentum is bullish. A close below the 9 SMA would negate the weekly bullish short-term trend signal to neutral.
WEEKLY PRICE MOMENTUM
With the market closing above The VC Weekly Price Momentum Indicator of 17.55 it confirms that the price momentum is bullish. A close below the VC Weekly, it would negate the bullish signal to neutral.
WEEKLY PRICE INDICATOR
Cover short on corrections at the 16.61 - 14.77 levels and go long on a weekly reversal stop. If long, use the 14.77 as a Close Only and Good Till Cancelled order. Look to take some profits on longs, as we reach the 19.38 - 20.32 levels during the week.
Direxion Daily Gold Miners Bull 3X Shares (NYSE:NUGT)
WEEKLY SUMMARY
TREND MOMENTUM: 30.82 Bullish
PRICE MOMENTUM: 31.77 Bullish
PRICE INDICATOR:
EXIT LONGS
2) 36.41
1) 34.76
EXIT SHORTS
1) 30.12
2) 27.13
WEEKLY TREND MOMENTUM
The contract closed at 33.11 The market closing above the 9 SMA 30.82 is confirmation that the trend momentum is bullish. A close below the 9 SMA would negate the weekly bullish short-term trend to neutral.
WEEKLY PRICE MOMENTUM
With the market closing above The VC Weekly Price Momentum Indicator of 31.77, it confirms that the price momentum is bullish. A close below the VC Weekly, it would negate the bullish signal to neutral.
WEEKLY PRICE INDICATOR
Cover short on corrections at the 30.12 27.13 levels and go long on a weekly reversal stop. If long, use the 27.13 as a Stop Close Only and Good Till Cancelled order. Look to take some profits on longs, as we reach the 34.76 - 36.41 levels during the week.

VelocityShares Long Silver (NASDAQ:USLV)
WEEKLY SUMMARY
TREND MOMENTUM: 11.40 Bullish
PRICE MOMENTUM: 12.13 Bullish
PRICE INDICATOR:
EXIT LONGS:
2) 14.19
1) 13.43
EXIT SHORTS
1) 11.37
2) 10.07
WEEKLY TREND MOMENTUM
The contract closed at 11.66 . The market closing above the 9 SMA 11.40 is confirmation that the trend momentum is bullish. A close below the 9 SMA would negate the weekly bullish short-term trend to neutral.
WEEKLY PRICE MOMENTUM
With the market closing above The VC Weekly Price Momentum Indicator of 12.13 it confirms that the price momentum is bullish. A close below the VC Weekly, it would negate the bullish signal to neutral.
WEEKLY PRICE INDICATOR
Cover short on corrections at the 11.37 - 10.07 levels and go long on a weekly reversal stop. If long, use the 10.07 level as a Stop Close Only and Good Till Cancelled order. Look to take some profits on longs, as we reach the 13.42 - 14.19 levels during the week.

Taseko Mines Limited (NYSE:TGB)
WEEKLY SUMMARY
TREND MOMENTUM: 1.35 Bullish
PRICE MOMENTUM: 1.53 Bearish
PRICE INDICATOR:
EXIT LONGS:
1) 1.57
1) 1.53
EXIT SHORTS
1) 1.50
2) 1.49
WEEKLY MOVING AVERAGES
The contract closed at 1.50. The market closing above the 9 SMA 1.35 is confirmation that the trend momentum is bullish. A close below the 9 SMA would negate the weekly bullish short-term trend to neutral.
WEEKLY MOMENTUM INDICATOR
With the market closing below The VC Weekly Price Momentum Indicator of 1.53, it confirms that the price momentum is bearish. A close above the VC Weekly, it would negate the bearish signal to neutral.
WEEKLY PRICE INDICATOR
Cover short on corrections at the 1.50 - 1.49 levels and go long on a weekly reversal stop. If long, use the 1.49 level as a Stop Close Only and Good Till Cancelled order. Look to take some profits on longs, as we reach the 1.53 - 1.57 levels during the week.

SPY (NYSE:SPY)
WEEKLY SUMMARY
TREND MOMENTUM: 246 Bearish
PRICE MOMENTUM: 246 Bearish
PRICE INDICATOR:
EXIT LONGS:
1) 251
1) 247
EXIT SHORTS
1) 242
2) 240
WEEKLY MOVING AVERAGES
The contract closed at 244.12 The market closing below the 9 SMA 244.51 is confirmation that the trend momentum is bearish. A close above the 9 SMA would negate the weekly bearish short-term trend to neutral.
WEEKLY MOMENTUM INDICATOR
With the market closing below The VC Weekly Price Momentum Indicator of 246, it confirms that the price momentum is bearish. A close above the VC Weekly, it would negate the bearish signal to neutral.
WEEKLY PRICE INDICATOR
Cover short on corrections at the 242 - 2.40 levels and go long on a weekly reversal stop. If long, use the 240 level as a Stop Close Only and Good Till Cancelled order. Look to take some profits on longs, as we reach the 247 - 251 levels during the week.

*Disclaimer: The information in the Market Commentaries was obtained from sources believed to be reliable, but we do not guarantee its accuracy. Neither the information nor any opinion expressed herein constitutes a solicitation of the purchase or sale of any futures or options contracts. This report is for educational purposes only.