Summary
Direxion Daily Junior Gold Miners Bull 3X Shares (NYSE:JNUG) Prediction Meets First Target
JNUG meets target predicted in October 10 report
New target is $20.84
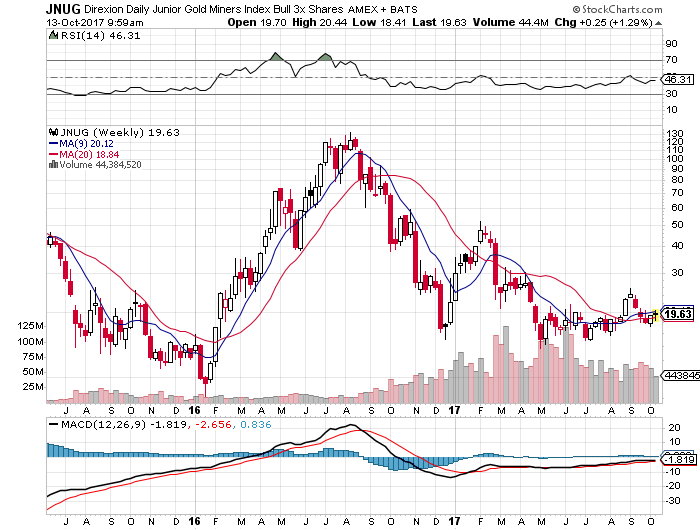
In my October 10, 2017 report, I recommended two aggressive plays to take advantage of the proprietary Variable Changing Price Momentum Indicator’s (VC PMI) forecast for bullish gold. One of the recommendations was for Direxion Daily Junior Gold Miners Index Bull 3X Shares ETF. Today (October 12), JNUG has already completed the first target (sell 1) forecast in the report, which was $20.11.

I recommended that coming into this week, if the JNUG price reached levels of $20.11 and $20.84, if you are long, you should gradually take profits off the table. JNUG already reached $20.44.
“The VC PMI gives you a level where you can see when the up-trend or the price momentum would be negated to neutral, which is $18.71. You can use $18.71 as a protective stop. If the market moves down to $18.71, then it automatically activates the extreme blow the mean levels of $17.98 and $16.58. The market might be moving lower. This would tell you to cover any bearish sentiment or short position at $17.98 to $16.58, with a trigger price of $17.98 and an automatic stop at $16.58. If the market moves down to $16.58, it would trigger a buy 2 signal, so you would hit a buy 1 trigger at $17.98 and buy 2 at $16.58. At that point, you would reverse and go long. If the market hits a trigger at $17.98 or $16.58, I recommend using $16.58 as your stop. If you buy at $17.98 and the market turns around and closes above $17.98, you can raise your stop at that point to $17.98, your entry point. The first target would then be $18.71, which is the price momentum level from the buy 1 or buy 2 levels. If the market closes above $18.71 twice, it would activate the upward targets of $20.11 and $20.84.”
We use the first and second levels of the extreme above the mean to provide a range of between 1 and 9. At 9, which we label the sell 2 level, the market is extremely overbought and the probability is 94% that the price will revert back to its mean or average price.
This concept relating to the mean took a long time for me to understand using technical analysis. I could not understand that when the market turns and begins a trend up, particularly on a long-term basis, and all the technical analysts see that signal as a buy signal, the majority of the time the market retraces back. I have found that once the price is accomplished to a price extreme above the mean, the market usually retraces back to the mean, with at least a 50% Fibonacci retracement 90% of the time. Why? Reversion to the mean.
Reversion or regression to the mean is a statistical term related to the phenomenon that if one measurement is extreme, then the next measurement will tend to be closer to the mean than the first.
Mean reversion trading looks to capitalize on extreme changes within the pricing of a particular security, based on the assumption that it will revert to its previous state. This theory can be applied to both buying and selling, as it allows a trader to profit on unexpected upswings and save at the occurrence of an abnormal low.
JNUG has met the sell 1 level of $20.11 and has come down to test the $18.71, the mean for the week, and has rallied back to where we are currently trading at $19.67 (12:27 pm PT, Thursday, October 12). The next target is $20.84, which is activated for the remainder of the week.
Disclaimer: The information in the Market Commentaries was obtained from sources believed to be reliable, but we do not guarantee its accuracy. Neither the information nor any opinion expressed herein constitutes a solicitation of the purchase or sale of any futures or options contracts. It is for educational purposes only.
