Less than four months ago, JNJ stock was trading below the $120 a share mark, down 20% from its all-time high of $148.32. A 20% decline is a pretty serious thing for investors, especially when we talk about blue chip stocks, which are considered to be less volatile and therefore safer bets. In fact, many believe that once a security has fallen by 20% it is officially in a bear market and more weakness can be expected.
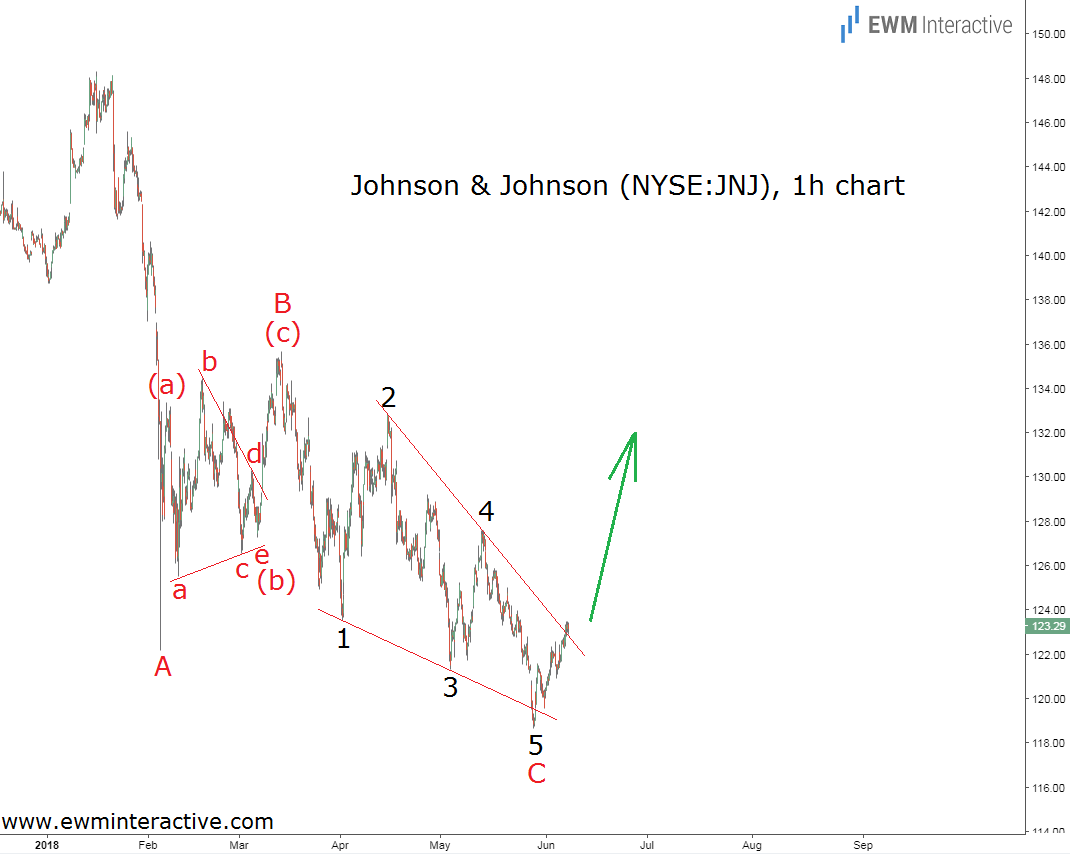
But instead of automatically jumping to a bearish conclusion simply because Johnson & Johnson (NYSE:JNJ) was down 20%, we decided to take a look at the Elliott Wave structure of this decline. The chart below, published on June 8th, revealed a much brighter picture.
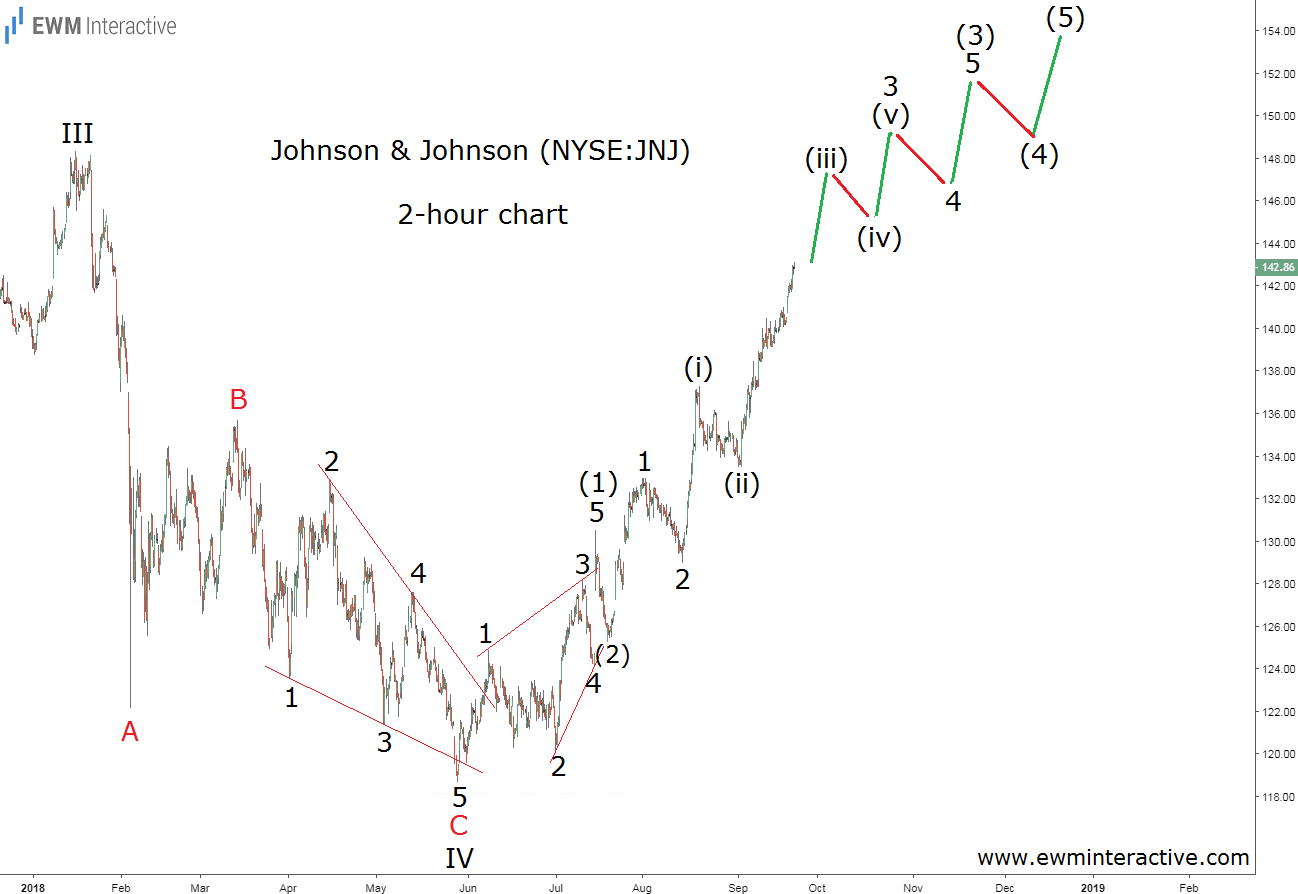
The 20% drop from $148.32 to $118.62 looked like a textbook A-B-C zigzag correction with an ending diagonal pattern in the position of wave C. Ralph N. Elliott once discovered that ending diagonals are often followed by a “swift and sharp reversal.” In other words, the structure of JNJ stock ‘s slump warned us not to join the bears near $123 a share in June and get ready for a major rally instead. Three and a half months later, here is an updated chart depicting JNJ’s progress.
The bulls needed a little time to regroup at first, but they never allowed a new low to be reached. $118.62 remained intact, so all investors had to do was stick to the analysis and stay long JNJ stock. Last Friday, Johnson and Johnson closed in the vicinity of $143 a share, up 15.9% since June 8th. Furthermore, it looks like a five-wave impulse is in progress. If that is correct, we can expect JNJ to keep rising and eventually reach and exceed the $150 mark.
JNJ Stock, the Big Picture
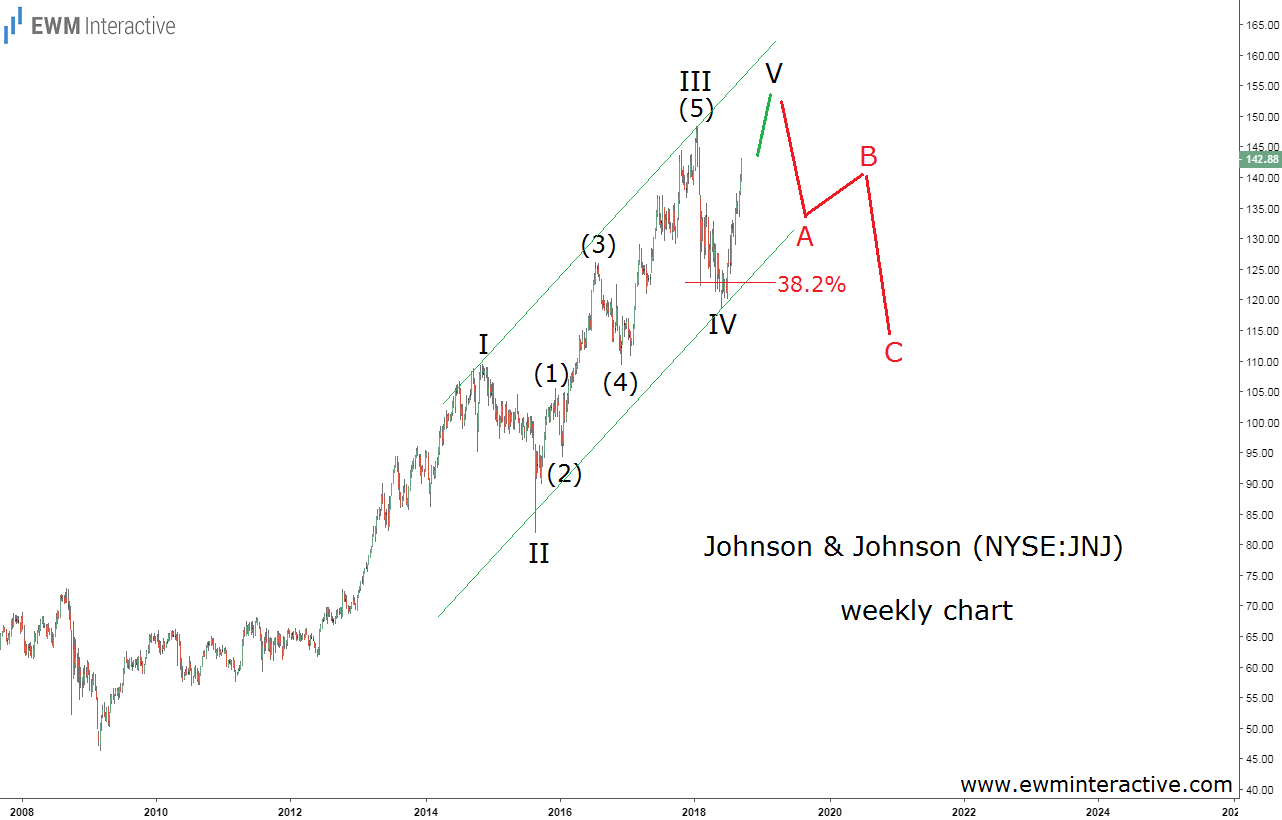
Then what? No trend lasts forever and as the last 20% dip demonstrated, even blue chip stocks are not immune to sudden price declines. In order to decide if holding JNJ stock above $150 is worth the risk, let’s take a look at its weekly chart. It reveals its entire uptrend since March, 2009.
As visible, the recent selloff to $118.62 fits in the position of wave IV within a larger five-wave advance from $46.25 in March, 2009. A support cluster formed by the 38.2% Fibonacci level and the lower line of the trend channel helped JNJ stock recover in the second half of 2018. The problem is that every impulse is followed by a three-wave correction in the opposite direction. Chances are good that the current rally is actually the fifth wave – V – of JNJ’s post-2009 bull market. A major three-wave decline can be expected as soon as it is over.
In conclusion, the Elliott Wave principle put us ahead of a strong and powerful recovery in a blue chip stock that was otherwise supposed to be in a bear market. The rally is not over as $150 is still there for the taking, but buying JNJ stock near all-time highs is probably not a good idea.
