Today, I’m featuring Amazon.com's (NASDAQ:AMZN)’s chart and why it went so insane.
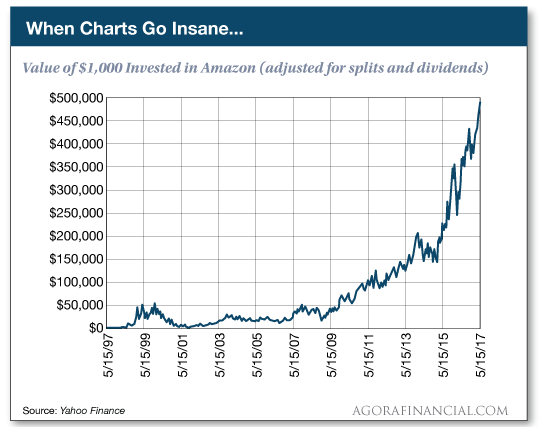
Of course, there are plenty of peripheral reasons that explain Amazon’s epic rise.
But one reason stands above the rest.
Are you ready for it?
Money loves speed, and Amazon knows this fact better than any company on Earth.
Unlike Apple (NASDAQ:AAPL), Google (NASDAQ:GOOGL) and Microsoft (NASDAQ:MSFT), Amazon is not fixated on a tightly designed ecosystem of interlocking apps and services… [CEO Jeff] Bezos instead emphasizes platforms that each serves its own customers in the best and fastest possible way. –Fast Company
Bezos’ obsession with speed continues to pay off for shareholders.
Yet despite such speed, Amazon’s chart still “works.”
However, tomorrow’s chart — the one I’ll unveil at 1 p.m. — is ready to break.
When I say break, I mean it sincerely… The price lines could soon stop working.
Remember, as I’ve explained in the last few issues of Wall Street Daily, this happens every time a takeover announcement hits the airwaves.
When a takeover is announced, it sends shares of the target company soaring so fast that the chart breaks.
That’s why I call these things “chartbreakers.”
Now, since the event is fast approaching, I’d like to share a few questions readers have sent in regarding this chart-breaking strategy.
Question: OK, so I get that it’s possible to collect windfalls approaching 1,000% from regular stocks using your “chartbreaker profits” strategy with just 24 hours of trading without options. But what type of stocks should I be targeting to find these kinds of opportunities?
Answer: Let me tell you a quick story about something I learned during my first day on the Street…
See, there’s ONE thing that keeps even the richest, most powerful Wall Street insiders up at night. It’s the ONE thing that can rob them of their mansions, Lamborghinis and trophy wives — in an instant.
Of course, I’m talking about uncertainty.
Uncertainty kills profits. Uncertainty creates doubts and triggers bad decisions. Uncertainty also keeps us from taking advantage of HUGE opportunities.
Solve the uncertainty problem and you can get wildly rich.
That’s why the Wall Street guys love the chartbreakers strategy I’ll show you in full during tomorrow’s event.
Question: How do you know all this, Louis?
Answer: I know all the secrets of Wall Street because I was one of them… for years.
Imagine being able to determine in advance how far a stock will rise — and when.
That’s the power we’re tapping into here, and it’s the driving force behind a whole new way to make money from the markets.
As you’re about to discover, once you understand how it works…
Not only can you use it to determine — in advance — which stocks are positioned to BREAK their charts…
You can also use it to determine exactly how much one of these chartbreakers could be worth 30 days… 60 days… even 90 days out.
To the penny!
You’re essentially ending the complete uncertainty that comes with the rest of the markets.
Question: How risky is this strategy, Louis?
Answer: Like I said before, the guys on Wall Street despise uncertainty…
And behind closed doors, they’ve actually found a way to eliminate it…
See, throughout my 13-year Wall Street career, I watched the insiders “mark” countless stocks ready to BREAK their charts…
And according to my back test, once these insiders “marked a stock to break,” 100% of the time the stock goes UP. It’s practically a mathematical certainty.
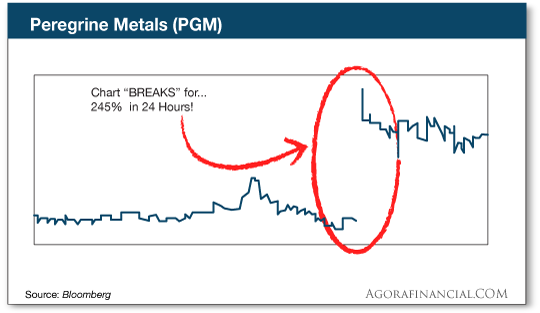
Like on July 8, 2011…
That day Peregrine Metals (TSX: PGM) broke its chart for a 245% gain:
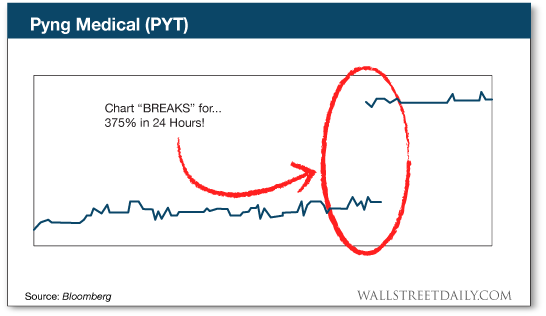
Or on Feb. 3, 2017…
When Pyng Medical Corp. (TSX-V: PYT) busted out for a 375% gain:
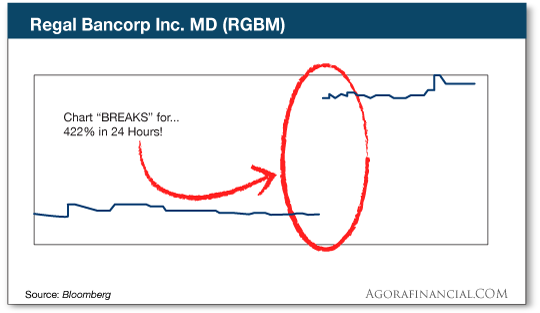
Or on Aug. 4, 2015…
When Regal Bancorp (PINK SHEETS: RGBM) let loose for 422%:
There was Jan. 29, 2016…
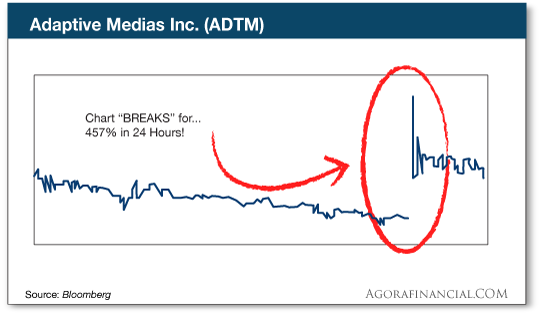
That day Adaptive Medias (OTCBB: ADTM) unleashed a 457% winner:
There was Jan. 17, 2013…
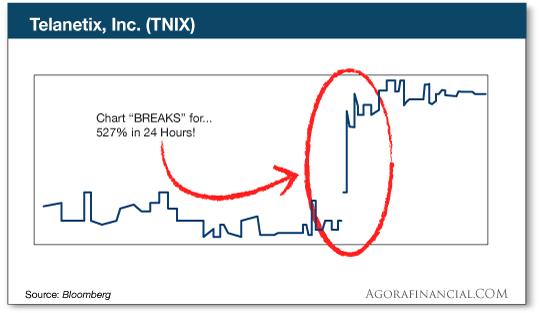
Where Telanetix (OTCBB: TNIX) broke off a 527% move:
There was Jan. 5, 2017…
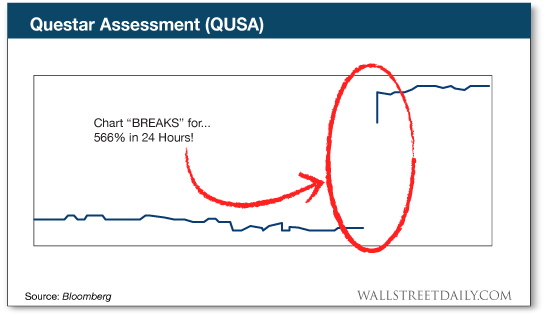
When Questar Assessment (OTCBB: QUSA) soared for 566%
Or how about Sept. 19, 2016…
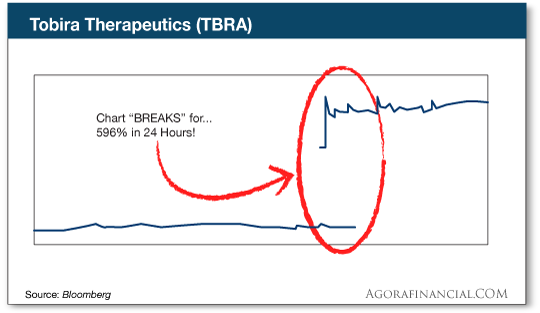
That’s when Tobira Therapeutics (NASDAQ: TBRA) surged up 596%:
And don’t forget about March 31, 2016…
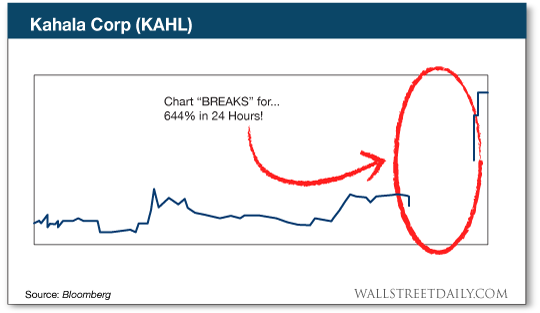
The day that Kahala Brands (OTCBB: KAHL) delivered 644%:
Or July 10, 2013…
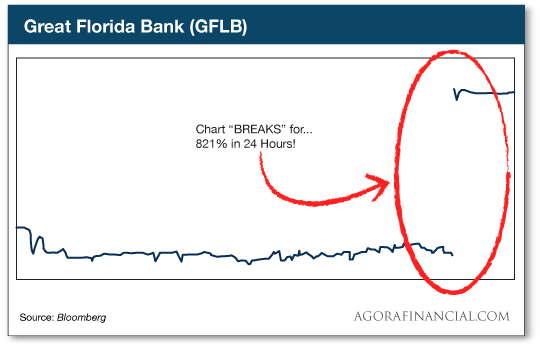
When Great Florida Bank (OTCBB: GFLB) racked up 821%:
And of course, my favorite, May 20, 2016…
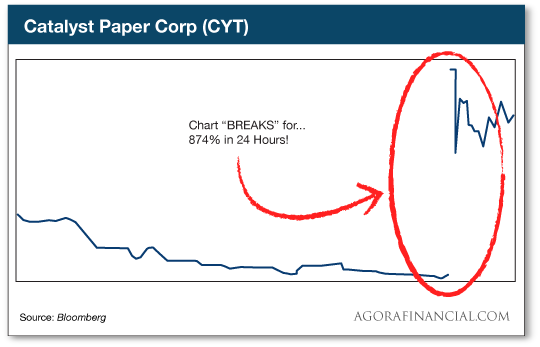
When Catalyst Paper Corp. (TSX: CYT) exploded upward by a whopping 874%:
Question: How can I find these potential chartbreakers in advance — BEFORE they unleash huge gains?
Answer: I covered this last week, but I’ll be glad to show you again.
Whenever I see a “M.A.R.K.E.D.” score of 80 or higher…
I know that the stock is poised to flash chart-breaking potential.
Take Kahala Brands, for example…
On March 31, 2016, you wouldn’t have noticed anything special about KAHL. Sure, you could have dug through all their income numbers that looked like this:
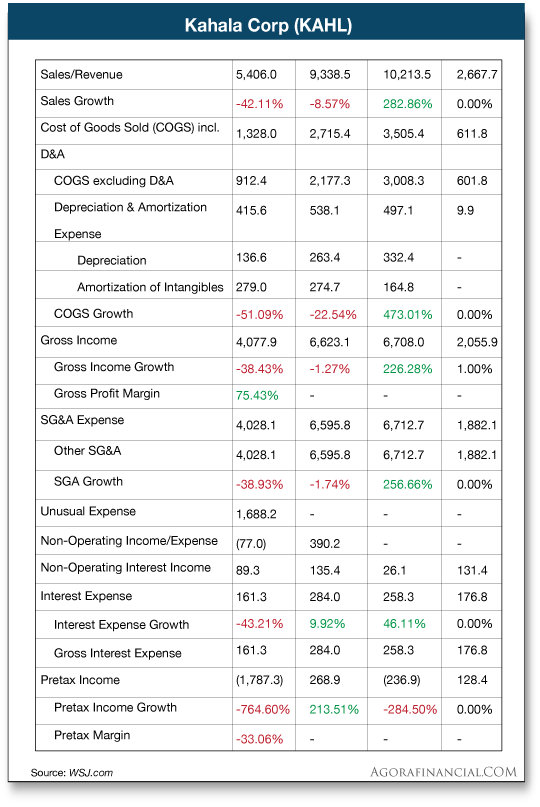
But the truth is you probably would’ve had absolutely no idea its chart was set to BREAK to the upside.
Yet according to my historical back test, KAHL could’ve received a M.A.R.K.E.D. score of 89…
And take a look at what happened next:
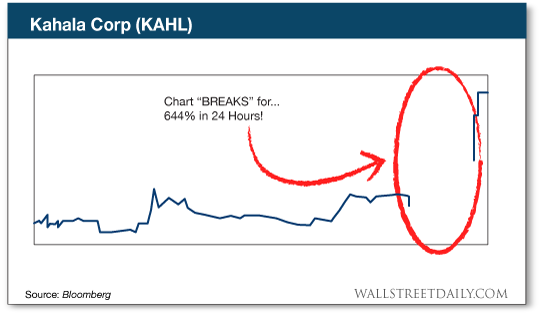
Did you see that?
KAHL broke the chart…
Unleashing gains of 644%.
Enough to turn every $10,000 invested into $74,400… in just 24 trading hours!
Here’s the really exciting part…
The higher the M.A.R.K.E.D. score, the bigger the gain potential!
Take Great Florida Bank, for example…
On July 10, 2013, you could’ve checked out the bank’s financial statement and your head would’ve spun trying to dig through the numbers…
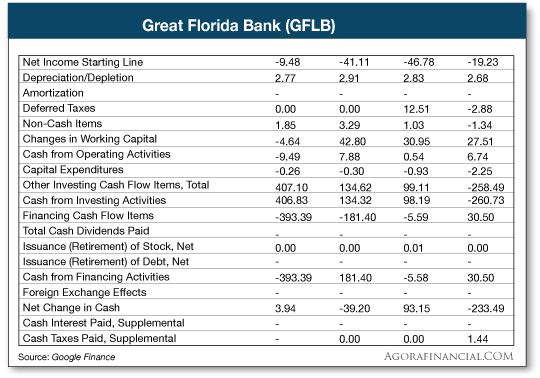
But my historical back test revealed that GFLB could’ve received a huge M.A.R.K.E.D. score of 93.
Watch what happened next:
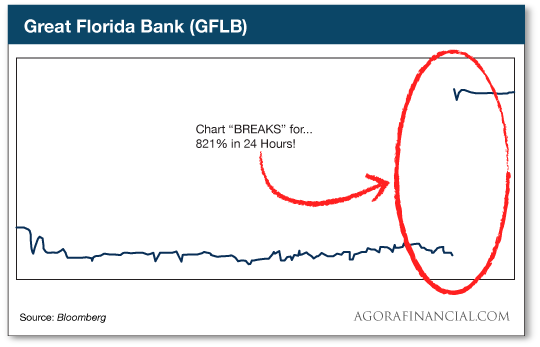
Out of nowhere, GFLB spiked up 821%.
Had you gotten into GFLB, you could’ve turned every $10,000 into $92,100… in 24 trading hours.
Question: How do I get into your Chartbreaker Profits event on Thursday? And what does it cost?
Answer: The event is 100% free to attend.
After that, we’ll send you an email with all the details on how to join.
During the event, you’ll see…
>>The full details on how Wall Street uses this chart-breaking “glitch” in the markets to pocket regular stock windfalls approaching 1,000% or more… in just 24 hours…
>>How when Wall Street takes advantage of this glitch on a chartbreaker stock… 100% of the time, the stock goes UP…
>>How my proprietary strategy harnesses the power of this glitch… spitting out ONE simple number you can use to see how to collect $100,048 in the next year…
