
ETF’s, Futures Swing Trading Instructions weekly 4.13 .17
Signals are automatically generated by integrating electronic prices and weekly statistics with proprietary algorithms.
WEEKLY SUMMARY
TREND MOMENTUM: 52.01 Bullish
PRICE MOMENTUM: 53.47 Bullish
PRICE INDICATOR
EXIT LONG:
S2) 54.94
S1) 54.27
EXIT SHORTS:
B1) 52.82
B2) 52.00
WEEKLY TREND MOMENTUM
The contract closed at 53.60 The market closing above the 9 SMA 52.01 is confirmation that the trend momentum is bullish. A close below the 9 SMA would negate the weekly bullish short-term trend to neutral.
WEEKLY PRICE MOMENTUM
With the market closing above The VC Weekly Price Momentum Indicator of 53.47 it confirms that the price momentum is bullish. A close below the VC Weekly, it would negate the bearish signal to neutral.
WEEKLY PRICE INDICATOR
Cover short on corrections at the 52.80 - 52.00 levels and go long on a weekly reversal stop. If long, use the 52.00 level as a Stop Close Only and Good Till Cancelled order. Look to take some profits on longs, as we reach the 54.27 - 54.94 levels during the week.

WEEKLY SUMMARY
TREND MOMENTUM: 2347 Bullish
PRICE MOMENTUM: 2348 Bullish
PRICE INDICATOR
EXIT LONGS:
2) 2396
1) 2377
EXIT SHORTS:
1) 2329
2) 2300
WEEKLY TREND MOMENTUM
The contract closed at 2328. The market closing below the 9 SMA 2357 is confirmation that the trend momentum is bearish. A close above the 9 SMA would negate the weekly bearish short-term trend to neutral.
WEEKLY PRICE MOMENTUM
With the market closing below The VC Weekly Price Momentum Indicator of 2338 it confirms that the price momentum is bearish. A close above the VC Weekly, it would negate the bearish signal to neutral.
WEEKLY PRICE INDICATOR
Cover short on corrections at the 2314 - 2299 levels and go long on a weekly reversal stop. If long, use the 2299 level as a Stop Close Only and Good Till Cancelled order. Look to take some profits on longs, as we reach the 2353 - 2377 levels during the week.

FFMGF
WEEKLY SUMMARY
TREND MOMENTUM: 0.69 Bearish
PRICE MOMENTUM: 0.59 Bearish
PRICE INDICATOR
EXIT LONGS:
S2) 0.62
S1) 0.60
EXIT SHORTS
B1) 0.57
B2) 0.56
WEEKLY TREND MOMENTUM
The contract closed at 0.57. The market closing below the 9 SMA 0.69 is confirmation that the trend momentum is bearish. A close above the 9 SMA would negate the weekly bearish short-term trend to neutral.
WEEKLY PRICE MOMENTUM
With the market closing below The VC Weekly Price Momentum Indicator of 0.59 it confirms that the price momentum is bearish. A close above the VC Weekly, it would negate the bearish signal to neutral.
WEEKLY PRICE INDICATOR
Cover short on corrections at the 0.57 - 0.56 levels and go long on a weekly reversal stop. If long, use the 0.56 level as a Stop Close Only and Good Till Cancelled order. Look to take some profits on longs, as we reach the 0.60 - 0.62 levels during the week.

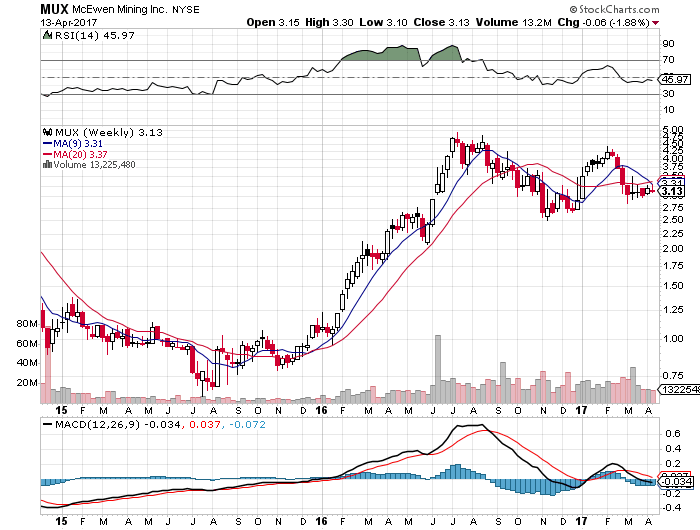
MUX (TO:MUX)
WEEKLY SUMMARY
TREND MOMENTUM: 3.43 Bearish
PRICE MOMENTUM: 3.18 Bullish
PRICE INDICATOR
EXIT LONGS:
S2) 3.41
S1) 3.30
EXIT SHORTS
B1) 3.07
B2) 2.95
WEEKLY TREND MOMENTUM
The contract closed at 3.13 The market closing below the 9 SMA 3.31 is confirmation that the trend momentum is bearish. A close above the 9 SMA would negate the weekly bearish short-term trend to neutral.
WEEKLY PRICE MOMENTUM
With the market closing below The VC Weekly Price Momentum Indicator of 3.18 it confirms that the price momentum is bearish. A close above the VC Weekly, it would negate the bearish signal to neutral.
WEEKLY PRICE INDICATOR
Cover short on corrections at the 3.05 - 2.98 levels and go long on a weekly reversal stop. If long, use the 2.98 level as a Stop Close Only and Good Till Cancelled order. Look to take some profits on longs, as we reach the 3.25 - 3.38 levels during the week.
JNUG (NYSE:JNUG)
WEEKLY SUMMARY
TREND MOMENTUM: 7.55 Bearish
PRICE MOMENTUM: 6.66 Bearish
PRICE INDICATOR
EXIT LONGS:
2) 6.83
1) 6.81
EXIT SHORTS:
- 6.64
- 6.49
WEEKLY TREND MOMENTUM
The contract closed at 6.80 The market closing below the 9 SMA 7.55 is confirmation that the trend momentum is bearish. A close above the 9 SMA would negate the weekly bearish short-term trend signal to neutral.
WEEKLY PRICE MOMENTUM
With the market closing above The VC Weekly Price Momentum Indicator of 6.68 it confirms that the price momentum is bullish. A close below the VC Weekly, it would negate the bullish signal to neutral.
WEEKLY PRICE INDICATOR
Cover short on corrections at the 6.64 - 6.49 levels and go long on a weekly reversal stop. If long, use the 6.49 as a Stop Close Only and Good Till Cancelled order. Look to take some profits on longs, as we reach the 6.81 - 6.83 levels during the week.

NUGT (NYSE:NUGT)
WEEKLY SUMMARY
TREND MOMENTUM: 9.80 Bullish
PRICE MOMENTUM: 10.74 Bullish
PRICE INDICATOR:
EXIT LONGS
2) 12.90
1) 12.03
EXIT SHORTS
1) 9.86
2) 8.58
WEEKLY TREND MOMENTUM
The contract closed above 11.15 The market closing above the 9 SMA 9.80 is confirmation that the trend momentum is bullish. A close below the 9 SMA would negate the weekly bullish short-term trend to neutral.
WEEKLY PRICE MOMENTUM
With the market closing above The VC Weekly Price Momentum Indicator of 10.74, it confirms that the price momentum is bullish. A close below the VC Weekly, it would negate the bullish signal to neutral.
WEEKLY PRICE INDICATOR
Cover short on corrections at the 9.87 - 8.58 levels and go long on a weekly reversal stop. If long, use the 8.58 level as a Stop Close Only and Good Till Cancelled order. Look to take some profits on longs, as we reach the 12.03 - 12.90 levels during the week.

USLV (NASDAQ:USLV)
WEEKLY SUMMARY
TREND MOMENTUM: 15.66 Bullish
PRICE MOMENTUM: 16.45 Bullish
PRICE INDICATOR:
EXIT LONGS:
2) 18.68
1) 17.89
EXIT SHORTS
1) 15.67
2) 14.24
WEEKLY TREND MOMENTUM
The contract closed at 17.11. The market closing above the 9 SMA 15.66 is confirmation that the trend momentum is bullish. A close below the 9 SMA would negate the weekly bullish short-term trend to neutral.
WEEKLY PRICE MOMENTUM
With the market closing above The VC Weekly Price Momentum Indicator of 16.46, it confirms that the price momentum is bearish. A close below the VC Weekly, it would negate the bullish signal to neutral.
WEEKLY PRICE INDICATOR
Cover short on corrections at the 15.67 - 14.24 levels and go long on a weekly reversal stop. If long, use the 14.24 level as a Stop Close Only and Good Till Cancelled order. Look to take some profits on longs, as we reach the 17.89 - 18.68 levels during the week.

TGB (NYSE:TGB)
WEEKLY SUMMARY
TREND MOMENTUM: 1.30 Bearish
PRICE MOMENTUM: 1.2 Bearish
PRICE INDICATOR:
EXIT LONGS:
1) 1.41
1) 1.28
EXIT SHORTS
1) 1.08
2) 1.01
WEEKLY MOVING AVERAGES
The contract closed at 1.15. The market closing below the 9 SMA 1.30 is confirmation that the trend momentum is bearish. A close above the 9 SMA would negate the weekly bearish short-term trend to neutral.
WEEKLY MOMENTUM INDICATOR
With the market closing below The VC Weekly Price Momentum Indicator of 1.21, it confirms that the price momentum is bearish. A close above the VC Weekly, it would negate the bearish signal to neutral.
WEEKLY PRICE INDICATOR
Cover short on corrections at the 1.08 - 1.01 levels and go long on a weekly reversal stop. If long, use the 1.01 level as a Stop Close Only and Good Till Cancelled order. Look to take some profits on longs, as we reach the 1.08 - 1.01 levels during the week.

JDST (NYSE:JDST)
WEEKLY SUMMARY
TREND MOMENTUM: 15.30 Bearish
PRICE MOMENTUM: 13.63 Bullish
PRICE INDICATOR:
EXIT LONGS:
1) 15.66
1) 14.77
EXIT SHORTS
1) 12.62
2) 11.48
WEEKLY MOVING AVERAGES
The contract closed at 13.77. The market closing below the 9 SMA 15.30 is confirmation that the trend momentum is bearish. A close above the 9 SMA would negate the weekly bearish short-term trend to neutral.
WEEKLY MOMENTUM INDICATOR
With the market closing above The VC Weekly Price Momentum Indicator of 13.63, it confirms that the price momentum is bullish. A close below the VC Weekly, it would negate the bullish signal to neutral.
WEEKLY PRICE INDICATOR
Cover short on corrections at the 12.62 - 11.48 levels and go long on a weekly reversal stop. If long, use the 11.48 level as a Stop Close Only and Good Till Cancelled order. Look to take some profits on longs, as we reach the 14.77 - 15.88 levels during the week.

*Disclaimer: The information in the Market Commentaries was obtained from sources believed to be reliable, but we do not guarantee its accuracy. Neither the information nor any opinion expressed herein constitutes a solicitation of the purchase or sale of any futures or options contracts. This report is for educational purposes only.