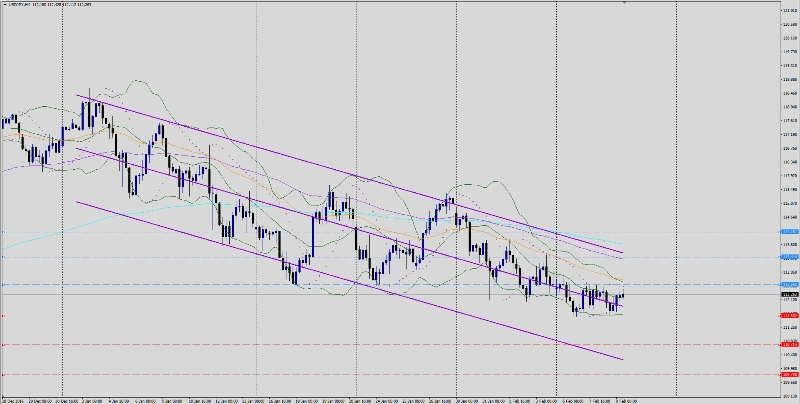
USD/JPY extended bearish momentum since 3rd Jan 2017 supported by recent positive Japanese data and US dollar uncertainty. Japan inaugurated early trading session with strong positive machinery orders at 6.7% compared to -5.1% on previous session indicating that manufactures will increase activity significantly. Recent bullish yen was supported by collapsing USD as the index plunged to 99.19, lowest since 2017.
US benchmark 10-year treasury yield sank at 2.367% low this weak, not buying Fed members Harker, Evans, and Williams hints of the possibility of March Fed rate hike. Meanwhile, the Japanese 10-year government bond yield remained flat lined around 0.10% and efforts by BOJ to buy unlimited 5 year and 10 year bonds on Friday with hopes to withhold the increase on longer yields was deserted. Mr. Nakaso, Deputy of BOJ's, crossed wires via Reuters earlier commented on the price outlook and long-term interest rate target being far long to achieve price goal.
Key headlines:
What's most important is to persistently pursue powerful monetary easing
Some in markets argue BOJ might mull raising long-term rate target, but momentum toward hitting price goal not yet sufficient
Risks to economic, price outlook remain skewed to downside
Global rise in stocks, long-term rates reflects improvements in economic fundamentals, not just hopes for trump's policies
Rises in Japan exports, output gaining momentum, broadening to various sectors
Eyes today are focused on US unemployment rates scheduled at 1:30 PM GMT and tomorrow's epic summit between Trump and PM Abe and subjects for discussion will be trades, currencies, security, macro-economy and China's current trade status is highly rated to be on the greasy menu.
Conclusion: Currently Japanese yen has the upper hand supported by recent strong data and it's considered a scared haven substitute proved by yesterday's negative local data and USD/JPY remained stable; the pair even showed bearish candle charts. Add to that Trump and US Fed currently not in accord due to different perspectives and agendas.
Trend: Bearish Sideways
Key levels to watch: Daily Pp 112.03
Resistance levels: R1 112.56, R2 113.41, R3 114.18
Support levels: S1 111.60, S2 110.71, S3 109.79
Note: This analysis is intended to provide general information and does not constitute the provision of INVESTMENT ADVICE. Investors should, before acting on this information, consider the appropriateness of this information having regard to their personal objectives, financial situation or needs. We recommend investors obtain investment advice specific to their situation before making any financial investment decision.
