
During the early hours of the Asian morning today, we have received the usual end-of-month data-drop from Japan. China also delivered its PMI figures for the month of April, which included the readings for composite, manufacturing and non-manufacturing ones. From Europe we will receive the eurozone’s preliminary YoY CPI figure for April, which is expected to have improved slightly. Canada will present the MoM GDP number and the US will Deliver the PCE figures.
Japan And China Reported Economic Data
During the early hours of the Asian morning today, we have received the usual end-of-month data-drop from Japan. The Japanese jobs to application ratio came out at 1.10, which is a slight improvement from the previous 1.09. This means that there are still more new jobs created than applications received. The Tokyo core YoY CPI for the month of April showed up as expected, at -0.2%. The headline one for the same month was a bit more disappointing. There was no initial forecast, but the previous figure was for -0.2%. The actual number came out at -0.6%. However, the Japanese unemployment showed up with an improved number of 2.6%, whereas the expectation was for the same as previous figure of 2.9%. Japanese industrial production came out at +2.2%, which was a strong improvement from the previous -1.3%. Manufacturing PMI was also on the higher side, appearing at 53.6 versus the 53.3 expected. Overall, the Japanese economy showed good results, meaning that the country is managing its pandemic period quite well. The Japanese yen strengthened somewhat against its major counterparts after, however, JPY will continue to be seen more as a risk currency, reflecting the overall market sentiment. If the markets suddenly switch to “risk-off” trading, yen-buying could take place.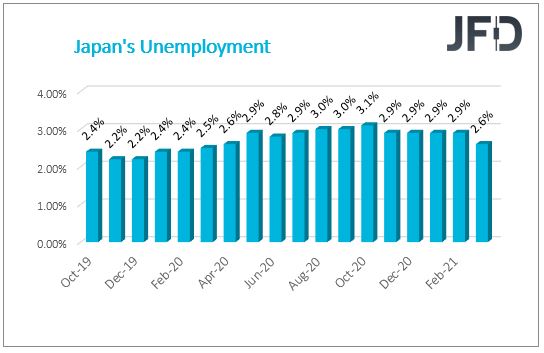
China also delivered its PMI figures for the month of April, which included the readings for composite, manufacturing and non-manufacturing ones. The initial forecast was only available for the manufacturing PMI, which was expected to drop slightly. The actual figure came out even below the forecast of 51.7, at 51.1. The other two, the composite and non-manufacturing one, also came out below their previous readings. China also released the heavily-watched Caixin Manufacturing PMI, where the initial forecast stood at 50.8, but the actual reading showed up at a much better 51.9.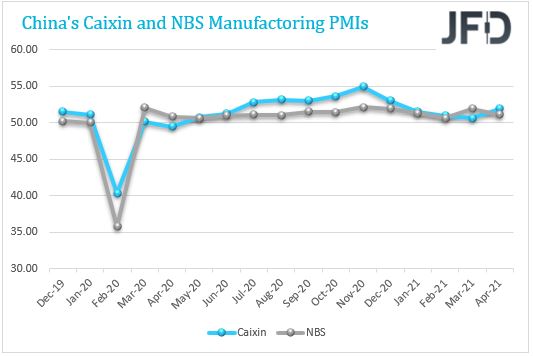
Europe Is Set To Deliver CPI
From Europe we will receive the eurozone’s preliminary YoY CPI figure for April, which is expected to have improved slightly, going from +1.3% to +1.6%. If the actual number appears to be even better than the forecast, this could give the euro support against some of its major counterparts. But what might really support the common currency is a positive preliminary Q1 GDP figure, which is set to be released today as well. This would be the first estimate of 2021. Since the pandemic started and countries went into lockdowns in March of last year, the number had never re-entered positive territory. The previous reading was at -4.9% and if the actual figure could at least get much closer to zero (not to mention getting into positive territory), this could really give EUR a good boost against its major counterparts.
EUR/JPY Technical Outlook
Although EUR/JPY is seen drifting lower at the time of writing, as long as the pair remains above a short-term upside support line drawn from the low of Apr. 23, that could keep the buyers interested for a bit. But given the pair’s proximity to that line, we will take a cautiously-bullish approach for now.
If the rate rebounds from the aforementioned upside line and then pushes back above the 132.19 hurdle, marked by the current high of today, that may attract more bulls into the field. EUR/JPY might travel to yesterday’s high, at 132.36, a break of which would confirm a forthcoming higher high, potentially leading the rate towards the 133.13 level. That level marks the highest point of September 2018.
On the downside, if the previously discussed upside line breaks and the pair falls below the 131.59 territory, marked by an intraday swing high and low of Apr. 28, that could invite more sellers into the game. EUR/JPY may travel to the 131.39 obstacle, a break of which could clear the way towards the 130.97 level, marked by the high of Apr. 20.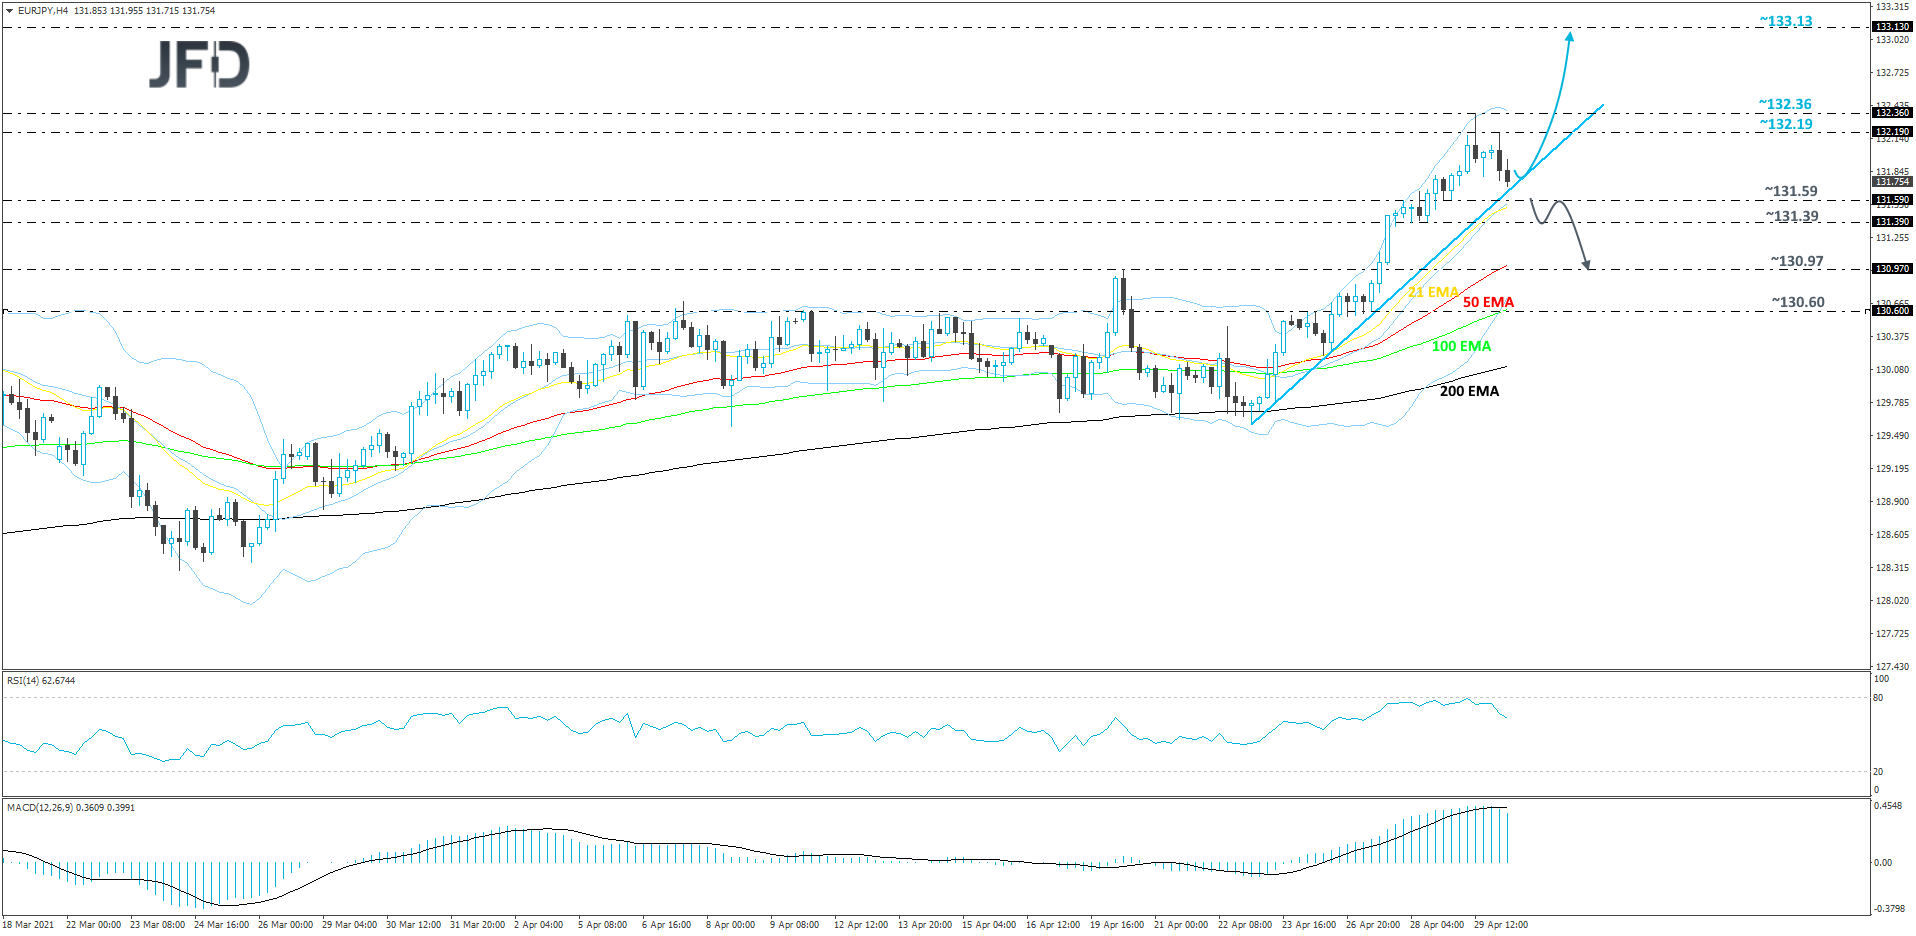
Canada Presents MOM GDP, US Delivers PCE Figures
Canada will also be the one, which will deliver its GDP reading, but only on a MoM basis for the month of February. The previous figure came out at +0.7%, but the current expectation is for the +0.5%.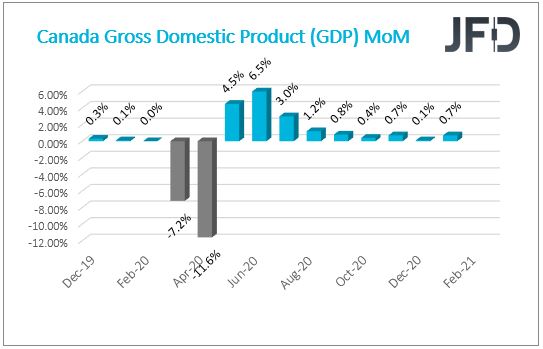
The US will fall under the spotlight as well, as it will be releasing its core and headline PCE inflation numbers on a MoM and YoY basis for the month of March. There are currently now forecasts for the headline ones, but the core rates are expected to rise. The PCE inflation readings are the Fed’s preferred inflation metric. This is due to the fact, that it takes into account various consumer expenditures and it is all weighted by data from the business surveys. Those surveys are considered to be more accurate than consumer surveys, which are used in the CPI calculation.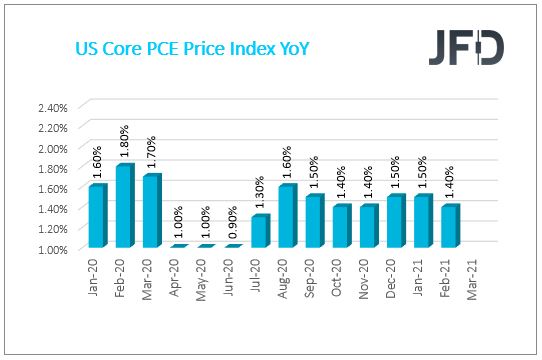
USD/CAD Technical Outlook
USD/CAD continues to slide, while trading below a short-term tentative downside resistance line taken from the high of Apr. 21s This morning, the pair found support near the 1.2268 hurdle and is now seen to be correcting higher. However, if the rate continues to trade below that downside line, we will remain bearish, at least with the near-term outlook.
A small push higher may bring the pair closer to the aforementioned downside line, which if remains intact, could keep the bears interested for a while more. If so, USD/CAD might drift back to the 1.2268 obstacle, a break of which would confirm a forthcoming lower low and may clear the path towards lower areas. We will then aim for the 1.2247 obstacle, a break of which could set the stage for a move to the 1.2195 zone, marked by the low of Sept. 20, 2017. Slightly below it lies another possible support area, at 1.2171, which is the low of Sept. 18, 2017.
On the other hand, if the pair is able to overcome the previously mentioned downside line and the rate pushes above the 1.2322 barrier, marked by yesterday’s high, that may change the direction of the current short-term trend. Such a move could attract more buyers into the game, possibly opening the way to some higher areas. That’s when we will aim for the 1.2385 hurdle, or even for the 1.2419 level, marked by the high of Apr. 27.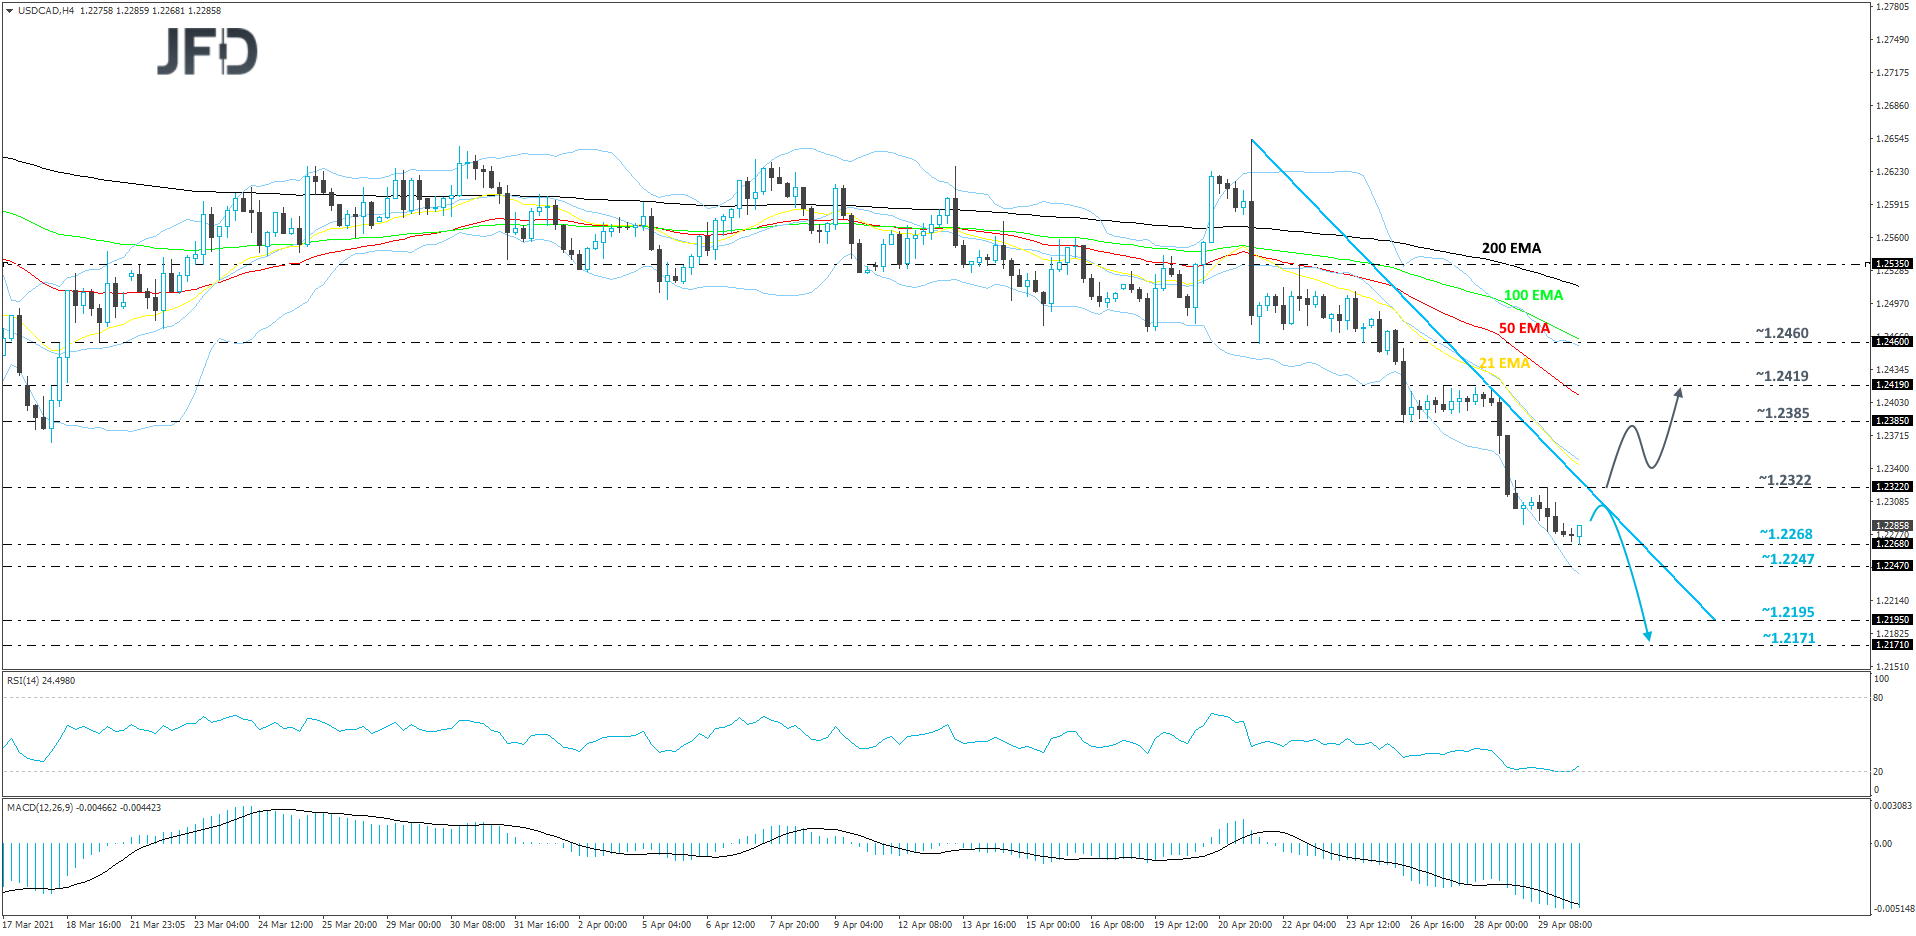
As For The Rest Of Today's Events
Today, we will also receive the US Michigan Consumer Sentiment figure for the month of April. Currently the expectation is for an improvement, going from 86.5 to 87.4. If that the actual figure shows up better than the forecast, this may help maintain the “risk-on” trading.