January 17’ Week 2
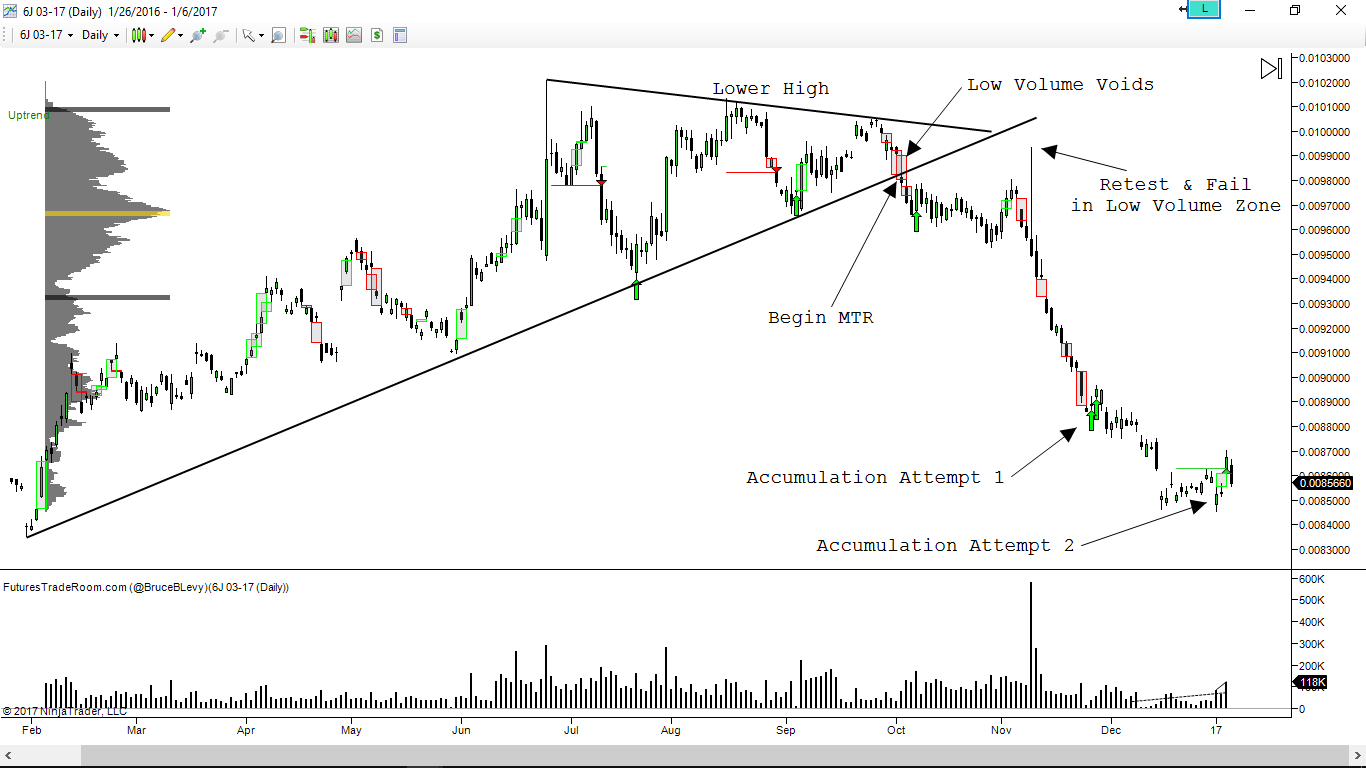
The yen has been in a Major Trend Reversal since early October. The area of focus for the next chart will be the yellow Point of Control (left side profile). You will notice how once the trendline has been broken to the downside it comes back up in early November to retest the underside of the trendline which coincides with the POC, or most amount of contracts traded at price.
6J 03-17 (Daily) Accumulation Attempt #2
Since the selloff there has been one prior accumulation attempt which actually gave us a measured move sell setup in a prior issue. We know this was a sell setup because the accumulation failed at a distinct level thus causing all longs to liquidate which added fuel to the selling. In the image below we now analyze the yen’s current trend change signal.
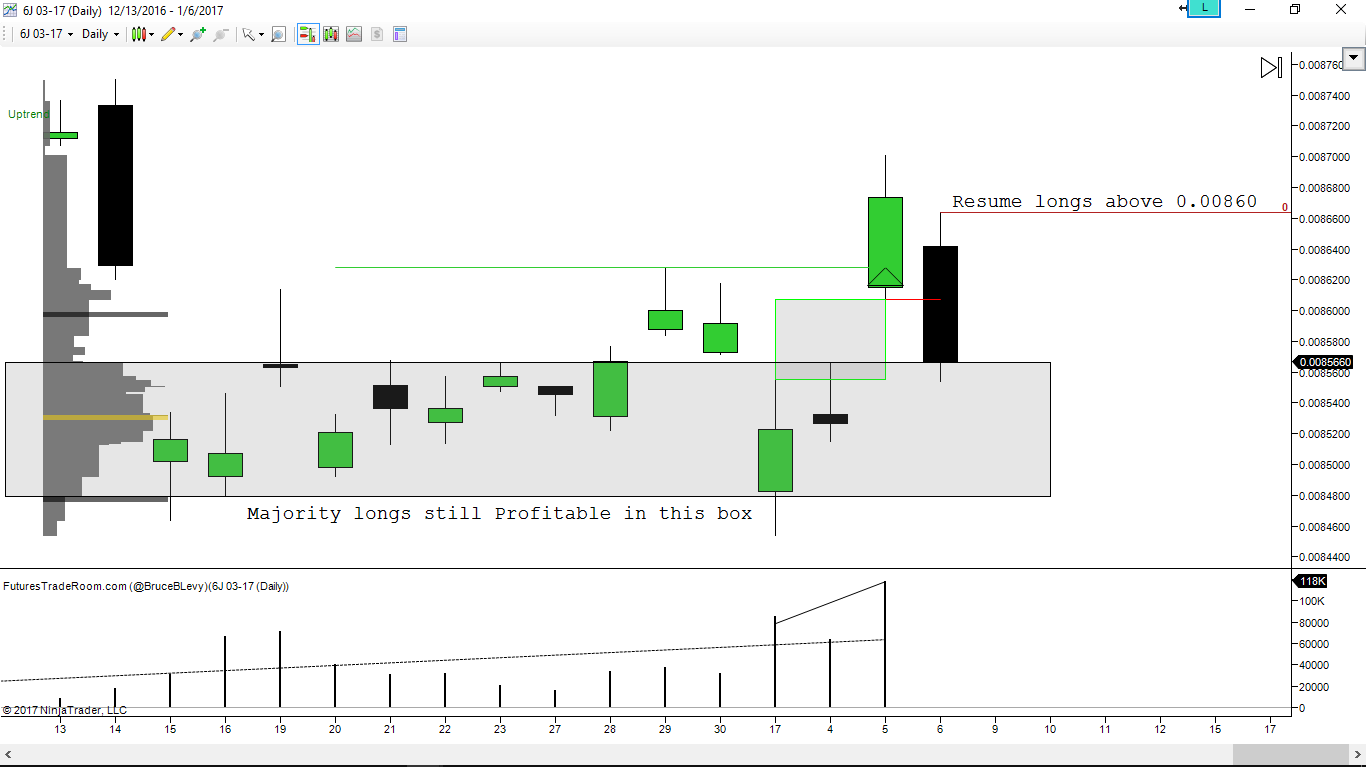
6J 03-17 (Daily) Buy Setup
Then yen has slightly stabilized since mid December. The rectangle shows the majority of volume traded for that period. On January 4th price closed negative but gapped up and closed on the highs the next day, clearing the prior trading range.
This is a classic FTR Market Maker Gap. It means there was highly aggressive, informed and organized buying. Friday was met with a lack of buying pressure but notice how it could not close below the price action gap (green outlined box). This box is a low volume void created in the last few days. If price can hold this level on a closing basis and get above 0.0086640 it will prompt a long entry for the yen.
We ignore the downside because the range of consolidation is wide and so it is unclear exactly where the point of no return will be. Any sell setups would probably take a week or two to develop a confirming bias. This confirming bias would involve price developing below the accumulation zone and coming back up for a failed retest.
The newsletter has a resting buy stop @ 0.0086640.
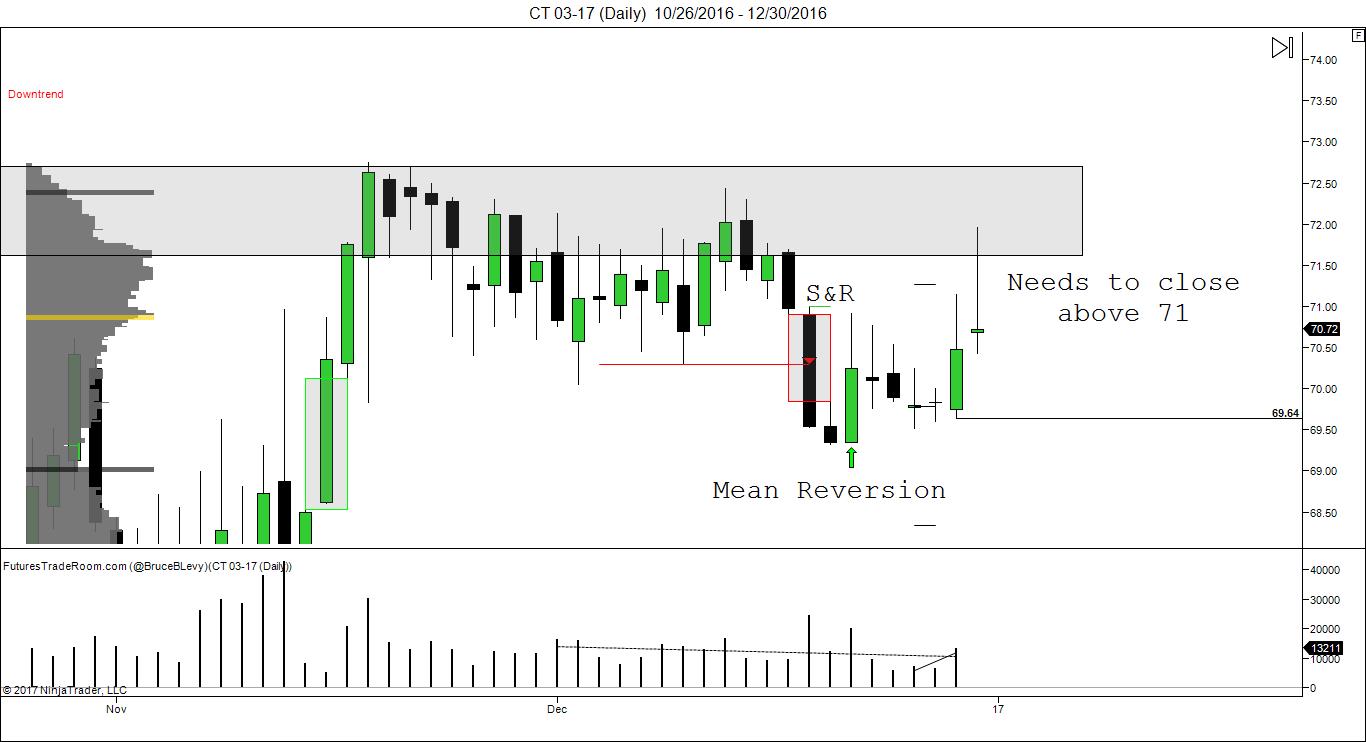
CT 03-17 (Daily) S&R Buy Setup, left chart is prior analysis
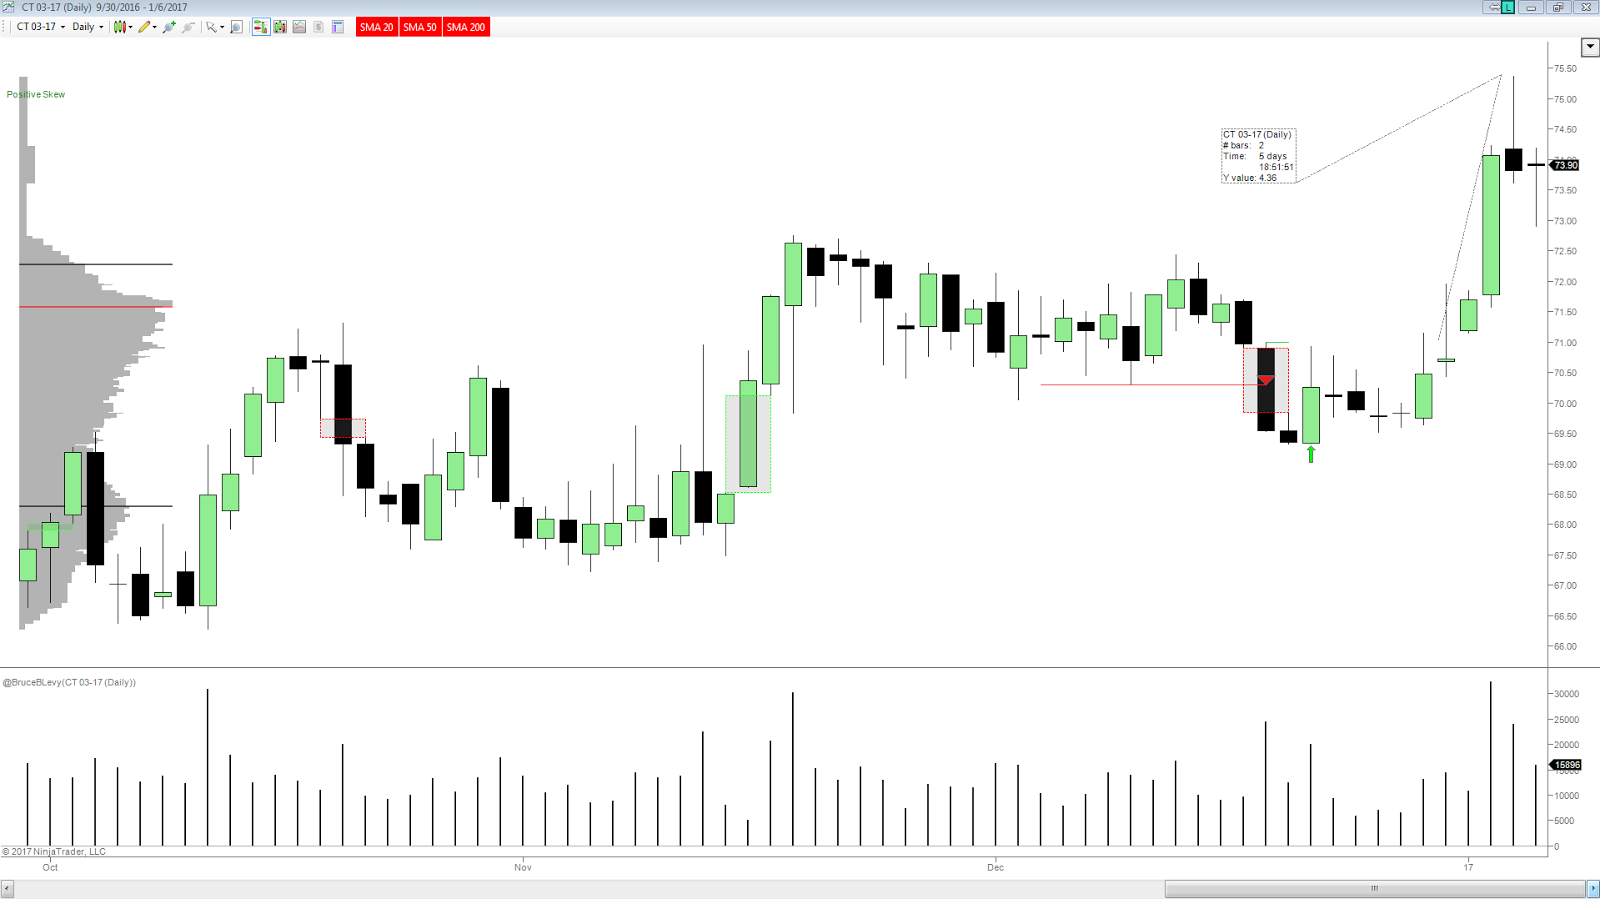
In last weeks newsletter we put out a buy alert for Cotton on a close above the Stop and Reverse Marker at 71. The market has quickly moved up $4.36 from this point as mean reversion buyers came in and sellers unraveled underwater positions. The market is now pausing for new information. It appears the buyers are in control but there is no safe setup for additional longs.
Newsletter is Flat CT and awaiting new information over the next two weeks.
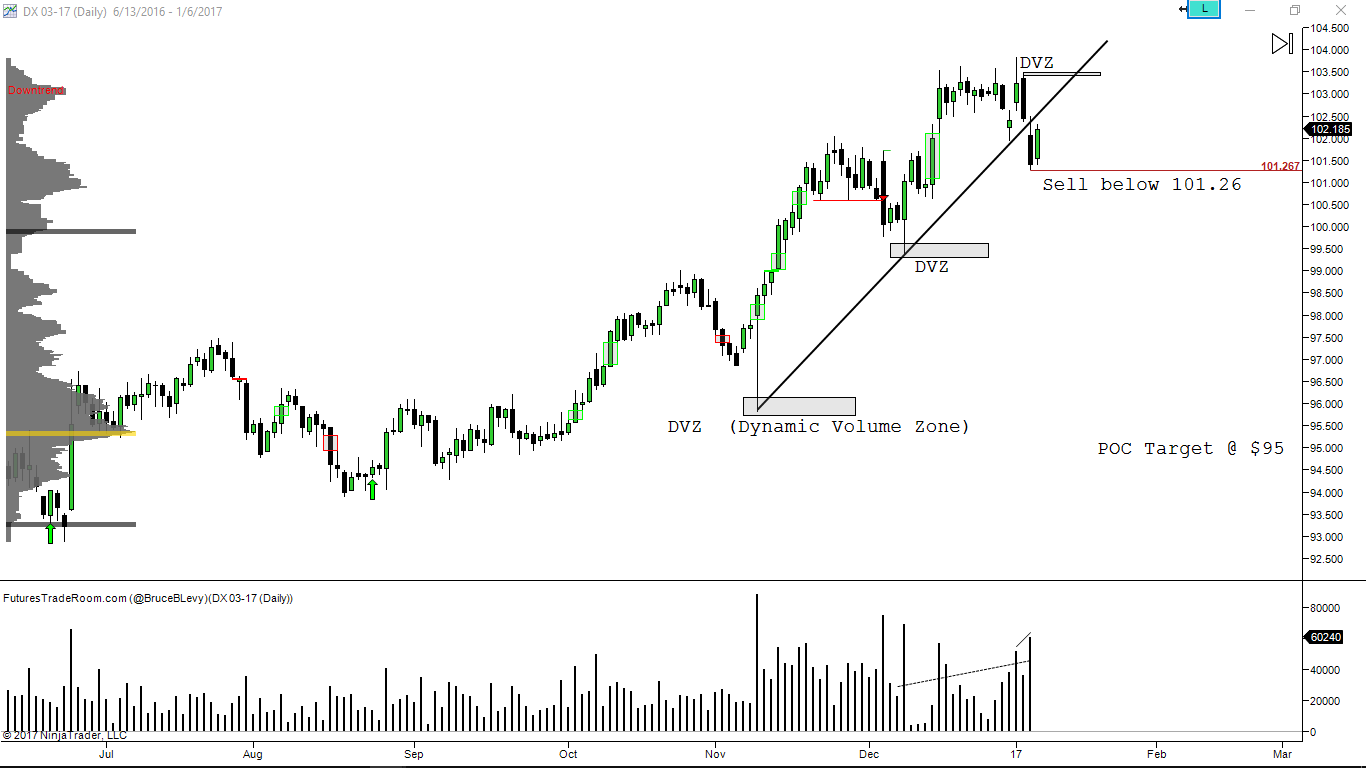
DX 03-17 (Daily) Possible MTR Forming
The bull trendline in the Dollar has accelerated into a 2 month speedline which has been broken on Thursday. A speedline is basically an increase in the upward angle of the trendline. An MTR (Major Trend Reversal) is in the very beginning stages of formation.
I refer to DVZ as Dynamic Volume Zones because these zones typically act as distinct areas of support and resistance going forward. Price will generally respect these levels going forward as the chart is developed. We use these areas as reference points to confirm the MTR.
The Newsletter will be short on a close below 101.29.
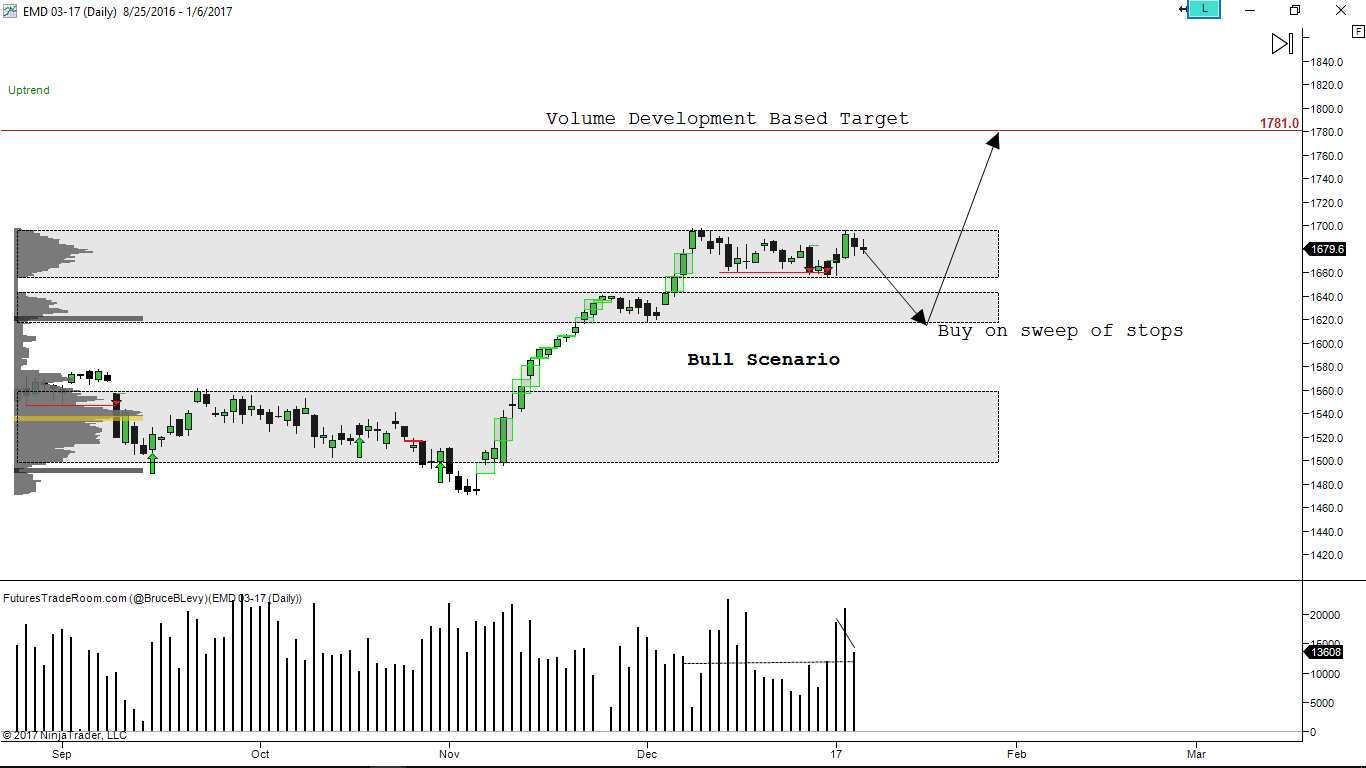
EMD 03-17 (Daily) “b” Profile Formation
The e-mini sp 400 is in consolidation at the moment. The current profile is in a “b” formation, meaning that price is getting ahead of volume. This divergence is usually followed by a pullback where price tends to fill in the area before continuing. We have given multiple long reentry opportunities for the EMD in the past newsletter updates. As of now I’d like to see a pullback to 1617 or even 1560s. Those two levels would be interesting to me and I’d be willing to take a long entry opportunity if given the chance. Stops would be the 3 day ATR calculated upon filling the position.
The Newsletter has a resting buy limit @ 1617.
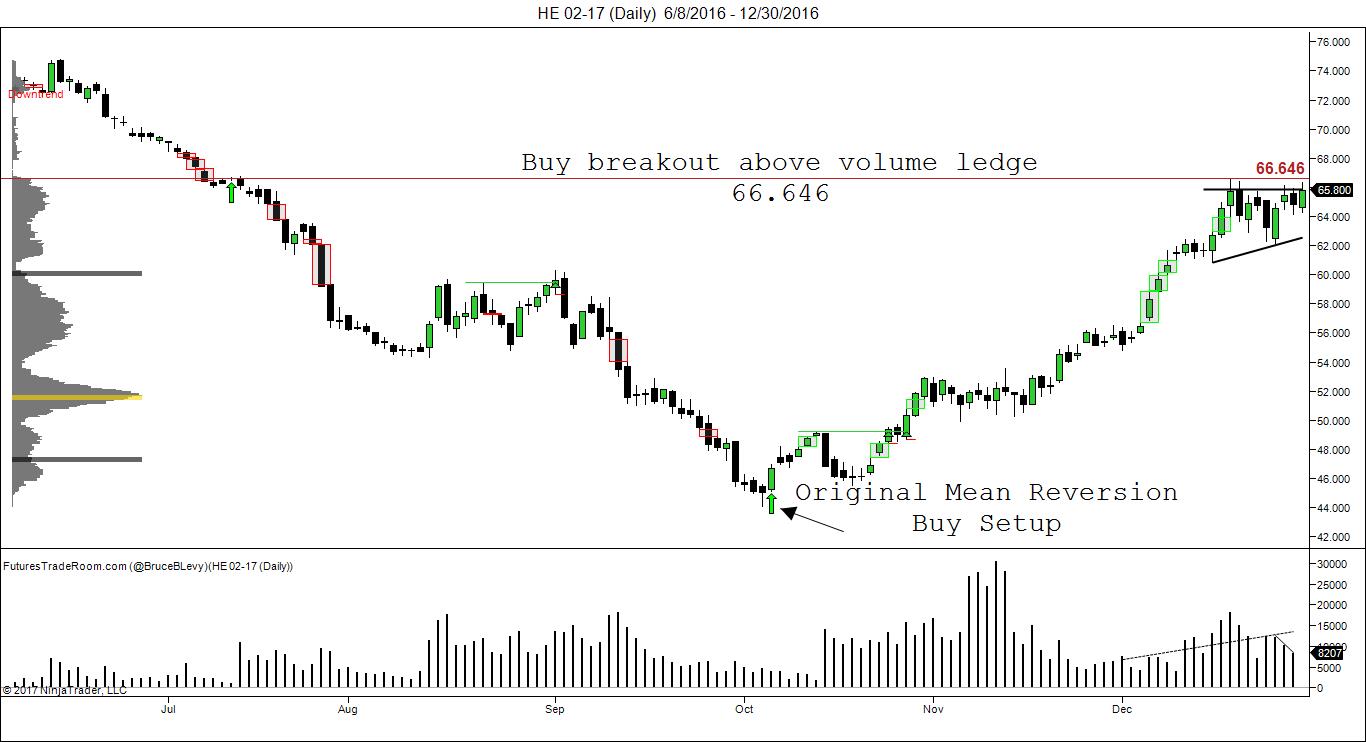
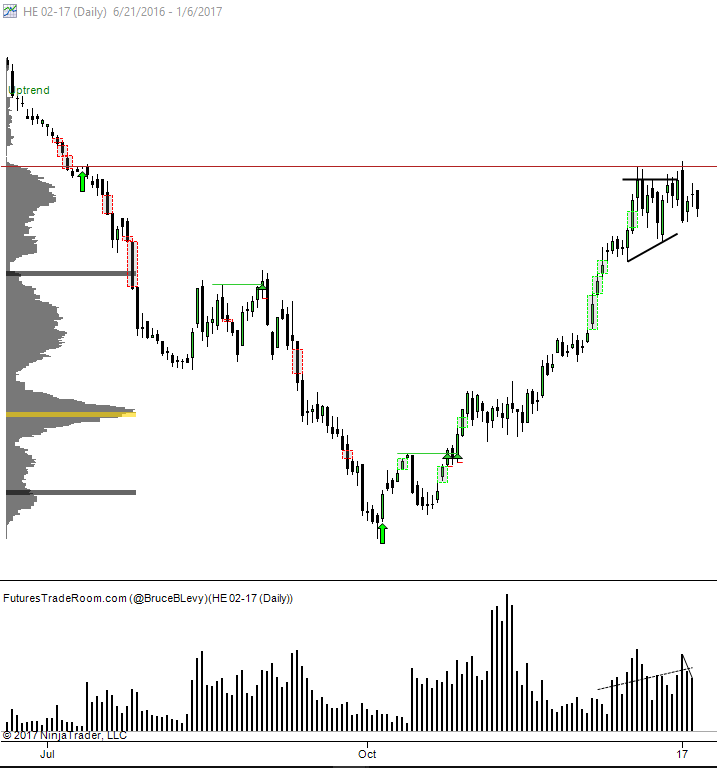
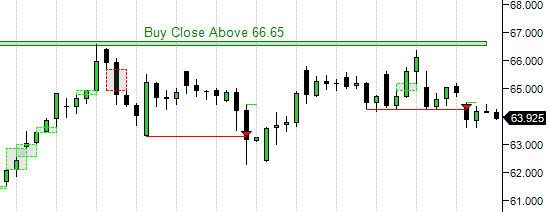
HE 02-17 (Daily) Ascending Triangle Formation
In the last update we identified the Ascending Triangle Formation but warned not to get too far ahead of ourselves by entering at market. Lean Hogs never triggered the buy signal which was a decisive close above 66.46.
As you can see volume interest on the profile completely dies off at this level. It seems that there may not be enough interest for a surge in prices to higher levels at this point. However, volume appears to be strong and so we will reinstate the long entry based on a close above this volume separation level.
The Newsletter will be long on a strong close above 65.50.
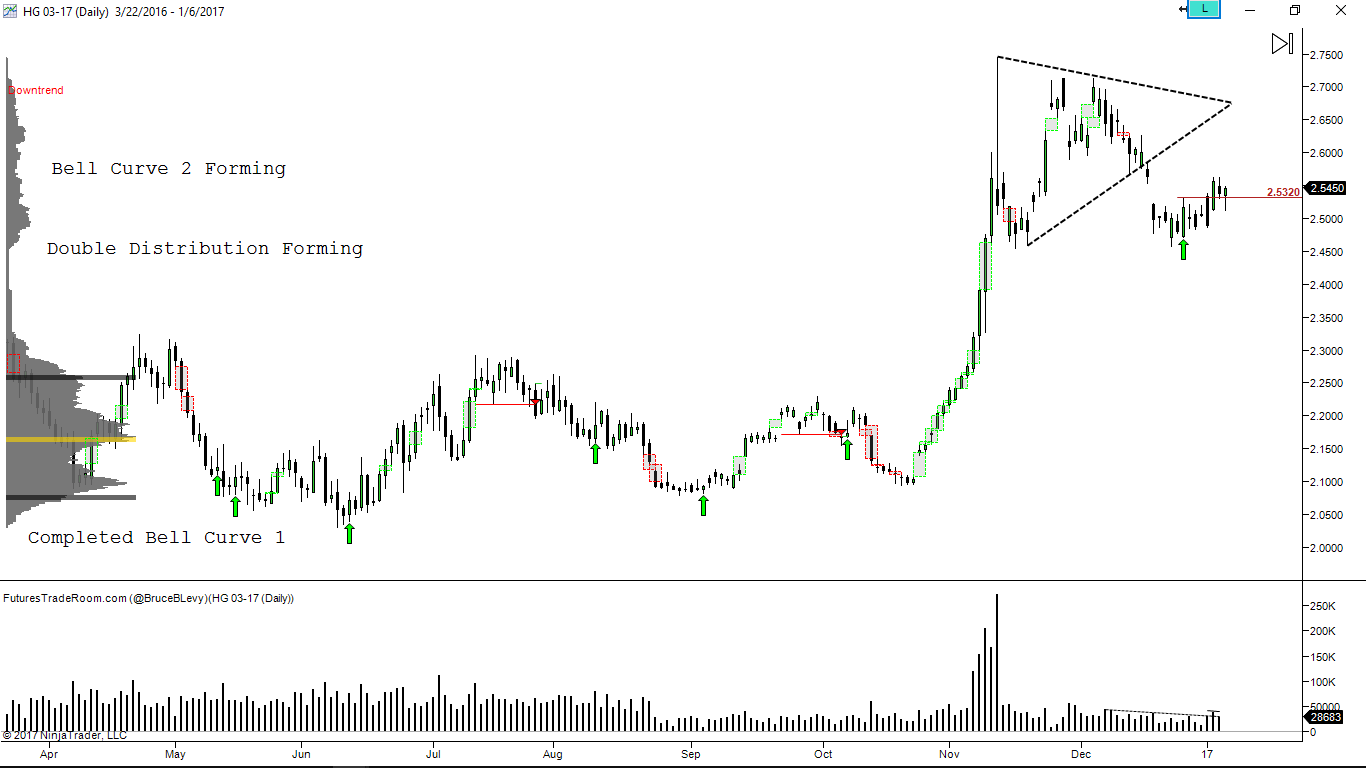
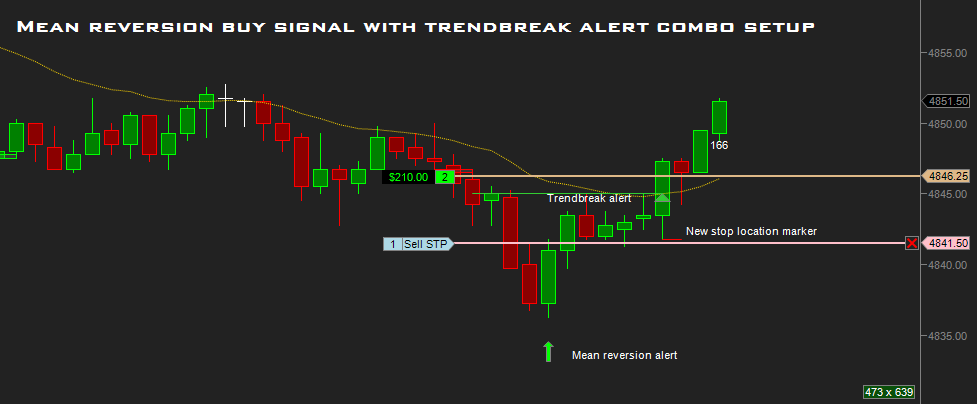
HG 03-17 (Daily) Mean Reversion Buy Setup
High Grade Copper has failed to break out of the Pennant formation and gave us a mean reversion buy setup in the last issue. A close above 2.53 warranted a long entry. It appears that HG has not only closed above 2.53 but has also tested the downside leaving behind bullish candle wicks which tell us there is additional buying pressure and HG does not want to spend time, or build value at lower prices.
The Newsletter will be entering long on Sunday’s Open.
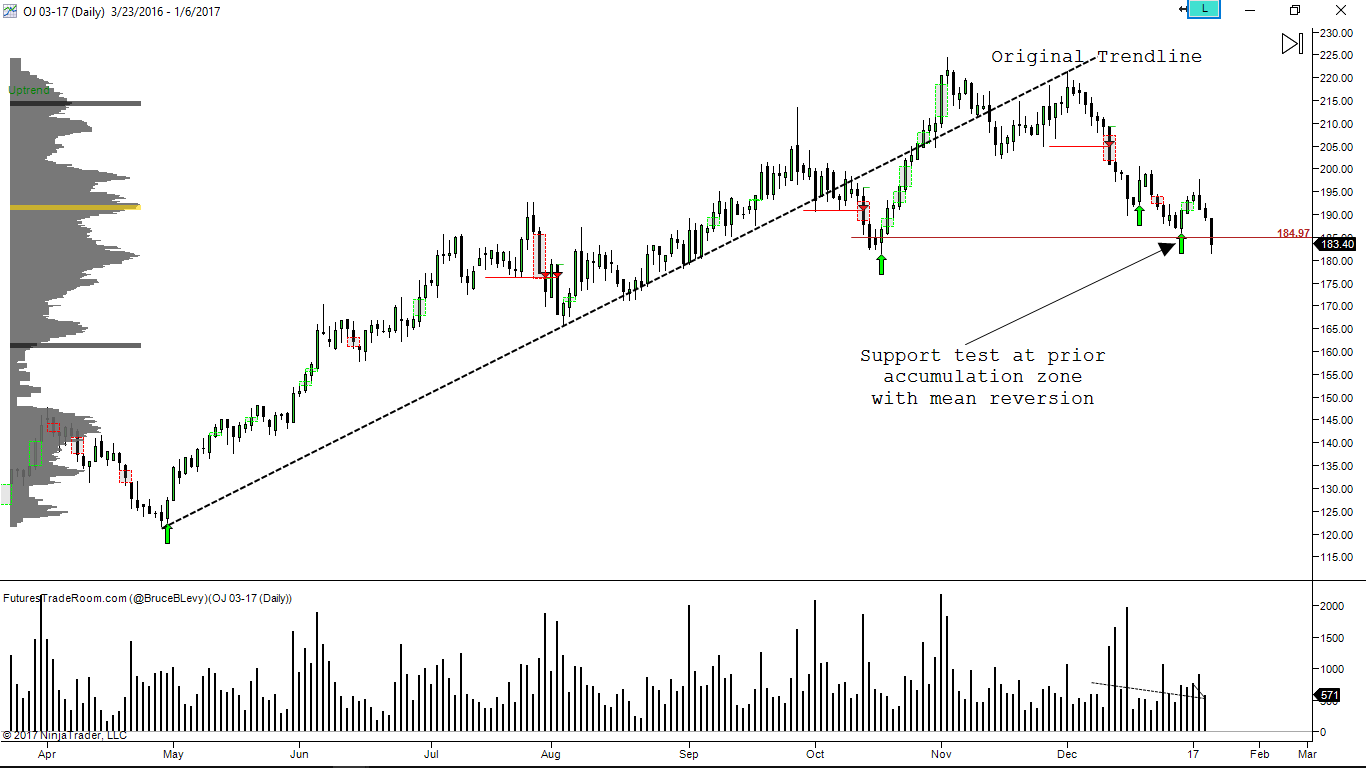
OJ 03-17 (Daily) Final stages of MTR
Orange Juice is about ready to begin the MTR selloff. It has closed into the prior mean reversion buy setup that was inline with a prior accumulation zone. This means the longs are about to take serious heat on their positions. A close below 180 would confirm the MTR reversal.
The Newsletter will enter short on Sunday’s Open.
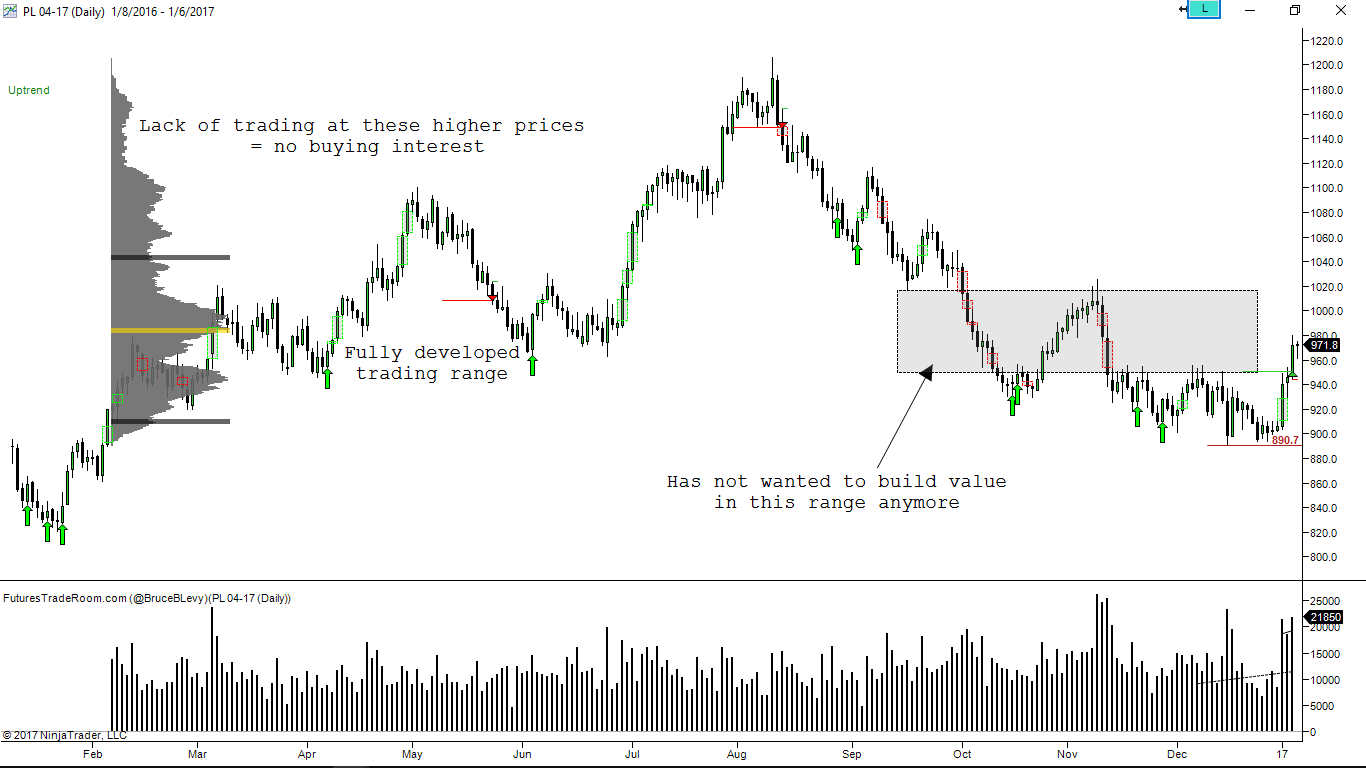
PL 04-17 (Daily) Testing prior trading range
Platinum avoided our sell setup at 890.70 before quickly reversing. We recevied a trend change alert with a close into the a trading range which appears to contain a fast market. PL does not want to trade in this range anymore and quickly trends through this area. I suspect that PL may find hesitation continuing to the upside and will be watching to see if we cross the S&R (Stop and Reverse marker) located at 945. No signals given we will check back in the next issue.
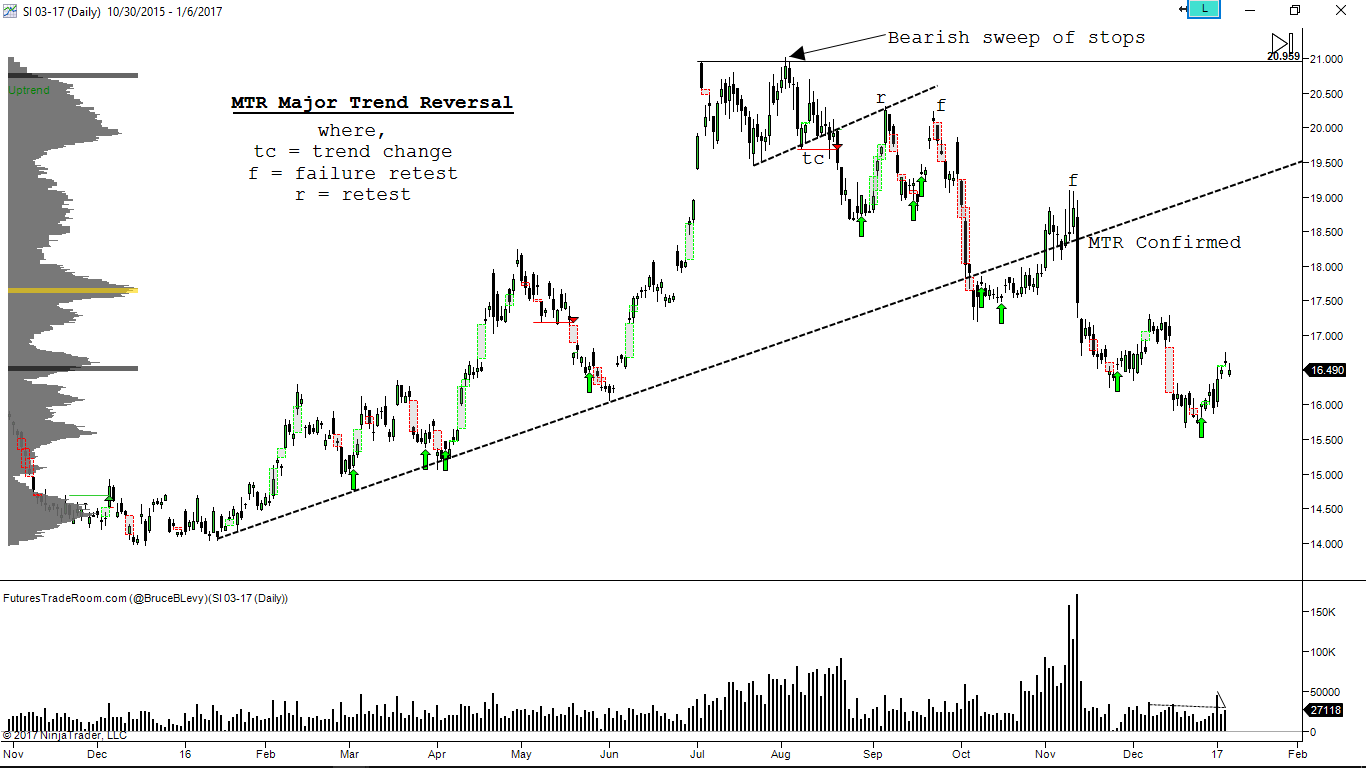
SI 03-17 (Daily) MTR in progress
Silver appears to be running out of steam during the latest upswing. It has put in a doji near the prior price action gap. There is no immediate signal but I am interested to see if it begins to put in a base to give us a long opportunity in the coming weeks.
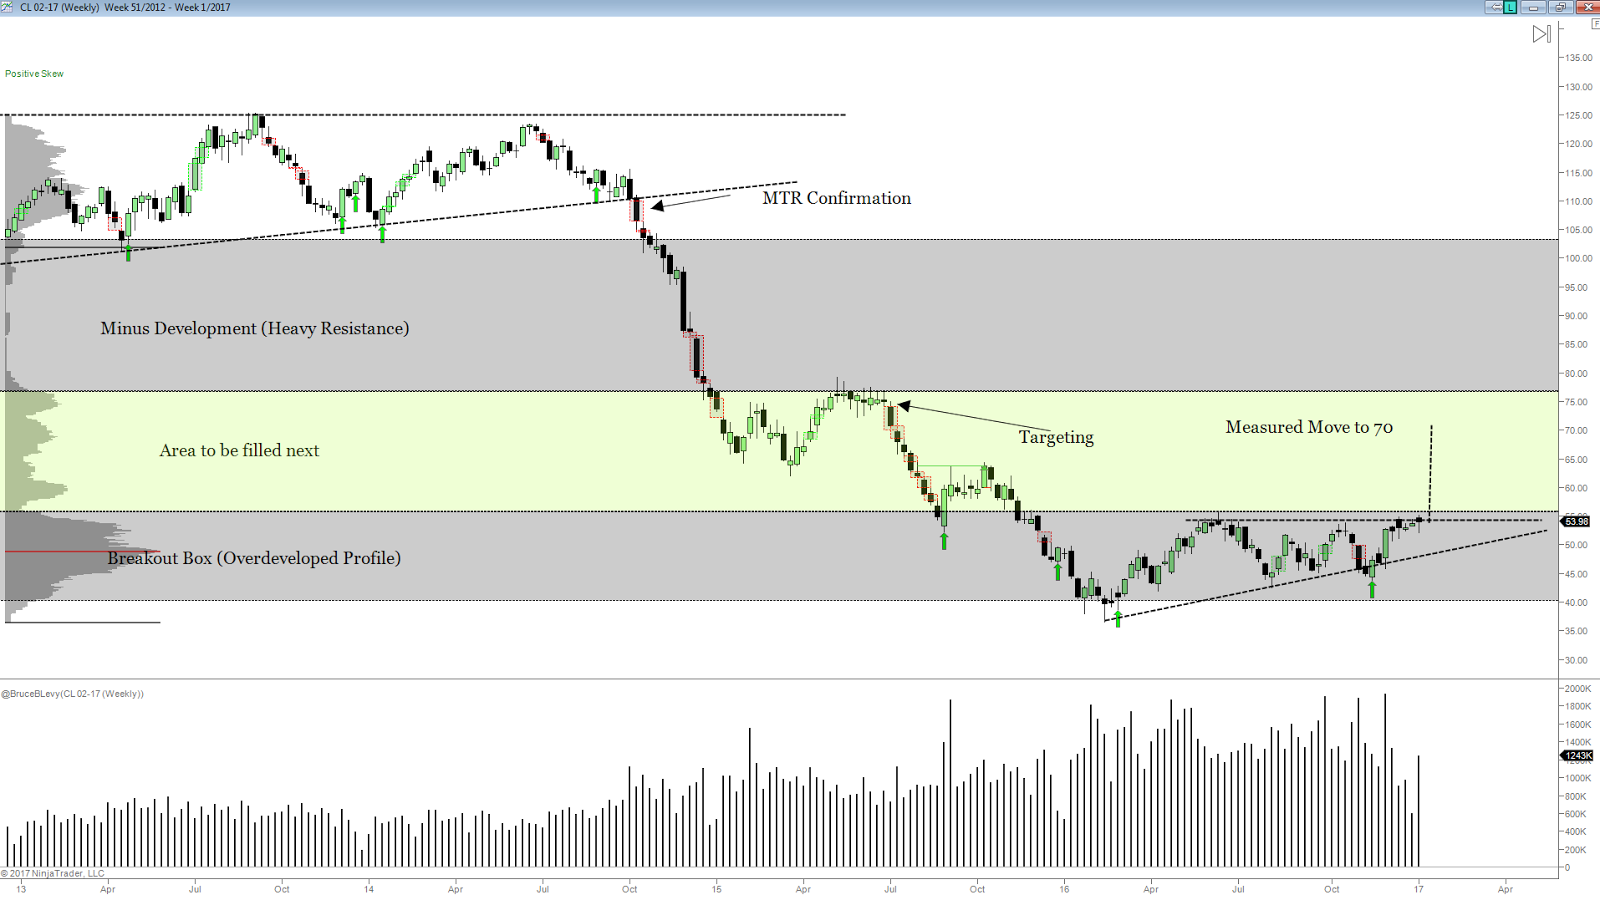
CL 02-17 (Weekly) Ascending Triangle
We have steered clear of Crude Oil in the past few issues since the original buy signal printed an entry at 47 for the Weekly chart. This signal has produced 7.74, or $7,740 per contract of Max Favorable Excursion. The newsletter took about 5 1/2 points out of the upswing. Now that it has reached prior highs it may be a good time to reset the signal and wait for a close above the Ascending Triangle before initiating any new trades.
The levels found in the newsletter have been updated to the FTR Zones Indicator.
About the Mechanical Trading System
The market can only do 3 things: Go up, down or sideways. Price does this by moving with value, or away from value. By understanding where the value (volume) is you can better understand how future prices will react to old levels. The Mechanical Trading System is designed to identify these changes and to alert the trader to potential setups as early as possible. The majority of the analysis found in this report comes from scanning with the mechanical trading system.
DISCLAIMER: FuturesTradeRoom is a publisher of trading software products. Any opinions should not be considered individual investment advice. All position shown on the charts above are for Newsletter tracking purposes only and may not have been taken in a live account. For the current purposes of this newsletter assume all trades are taken in a hypothetical manner. See CFTC Rule 4.41 below.
Through use of this website viewing, using, communicating with or purchasing products/services you agree to hold www.futurestraderoom.com, its operators, owners, and any affiliates, officers, directors, employees or related person(s) harmless and to completely release them from any and all liability for any loss or damage you may incur. The information contained in our website, message board posts, videos, chats, screenshots, emails, social media, newsletters or in any other medium including and not limited to written and verbal statements should be viewed as personal opinion and is not intended to be individual investment advice, or to be relied upon as such. Online trading systems, programs, indicators, automated strategies are subject to a variety of technological problems including (but not limited to) software, hardware, and data interruptions. We are not responsible for these technological failures or delays. We are not liable for any loss or damage which may arise directly or indirectly from use of or reliance on any of our products or services.
HYPOTHETICAL PERFORMANCE DISCLAIMER CFTC RULE 4.41 HYPOTHETICAL PERFORMANCE DISCLAIMER: HYPOTHETICAL PERFORMANCE RESULTS HAVE MANY INHERENT LIMITATIONS, SOME OF WHICH ARE DESCRIBED BELOW. NO REPRESENTATION IS BEING MADE THAT ANY ACCOUNT WILL OR IS LIKELY TO ACHIEVE PROFITS OR LOSSES SIMILAR TO THOSE SHOWN; IN FACT, THERE ARE FREQUENTLY SHARP DIFFERENCES BETWEEN HYPOTHETICAL PERFORMANCE RESULTS AND THE ACTUAL RESULTS SUBSEQUENTLY ACHIEVED BY ANY PARTICULAR TRADING PROGRAM. ONE OF THE LIMITATIONS OF HYPOTHETICAL PERFORMANCE RESULTS IS THAT THEY ARE GENERALLY PREPARED WITH THE BENEFIT OF HINDSIGHT. IN ADDITION, HYPOTHETICAL TRADING DOES NOT INVOLVE FINANCIAL RISK, AND NO HYPOTHETICAL TRADING RECORD CAN COMPLETELY ACCOUNT FOR THE IMPACT OF FINANCIAL RISK OF ACTUAL TRADING. FOR EXAMPLE, THE ABILITY TO WITHSTAND LOSSES OR TO ADHERE TO A PARTICULAR TRADING PROGRAM IN SPITE OF TRADING LOSSES ARE MATERIAL POINTS WHICH CAN ALSO ADVERSELY AFFECT ACTUAL TRADING RESULTS. THERE ARE NUMEROUS OTHER FACTORS RELATED TO THE MARKETS IN GENERAL OR TO THE IMPLEMENTATION OF ANY SPECIFIC TRADING PROGRAM WHICH CANNOT BE FULLY ACCOUNTED FOR IN THE PREPARATION OF HYPOTHETICAL PERFORMANCE RESULTS AND ALL WHICH CAN ADVERSELY AFFECT TRADING RESULTS.
In the end all trades are your own to take.

