
James Barrow is a relatively unknown fund manager but he has a big influence on Wall Street. His assets under management exceeded the 55 billion mark at his investment firm Barrow, Hanley, Mewhinney & Strauss. This money is spread across 159 stocks. Barrow follows a value oriented investment strategy.
Barrow is also a large cap dividend stock lover. Nearly all of his 20 most recent large cap stock acquisitions pay dividends. His biggest position is the tobacco company Philip Morris.
Merck (MRK) has a market capitalization of $144.82 billion. The company employs 82,000 people, generates revenue of $47.267 billion and has a net income of $6.299 billion. The firm’s earnings before interest, taxes, depreciation and amortization (EBITDA) amounts to $22.343 billion. The EBITDA margin is 47.27 percent (the operating margin is 18.49 percent and the net profit margin 13.33 percent).
Financial Analysis: The total debt represents 19.38 percent of the company’s assets and the total debt in relation to the equity amounts to 38.79 percent. Due to the financial situation, a return on equity of 11.47 percent was realized. Twelve trailing months earnings per share reached a value of $1.96. Last fiscal year, the company paid $1.68 in the form of dividends to shareholders. The MRK stake purchase had an influence of 0.99 percent to his portfolio. The position is currently 12 percent in gain.
Market Valuation: Here are the price ratios of the company: The P/E ratio is 24.44, the P/S ratio is 3.06 and the P/B ratio is finally 2.74. The dividend yield amounts to 3.59 percent and the beta ratio has a value of 0.58.


BP (BP) has a market capitalization of $133.86 billion. The company employs 85,700 people, generates revenue of $388.285 billion and has a net income of $11.816 billion. The firm’s earnings before interest, taxes, depreciation and amortization (EBITDA) amounts to $39.891 billion. The EBITDA margin is 10.27 percent (the operating margin is 5.08 percent and the net profit margin 3.04 percent).
Financial Analysis: The total debt represents 16.26 percent of the company’s assets and the total debt in relation to the equity amounts to 41.21 percent. Due to the financial situation, a return on equity of 10.07 percent was realized. Twelve trailing months earnings per share reached a value of $6.99. Last fiscal year, the company paid $1.98 in the form of dividends to shareholders. The BP stake purchase had an influence of 0.76 percent to his portfolio. The position is currently 1 percent in loss.
Market Valuation: Here are the price ratios of the company: The P/E ratio is 6.03, the P/S ratio is 0.34 and the P/B ratio is finally 1.13. The dividend yield amounts to 4.99 percent and the beta ratio has a value of 1.23.


SYSCO (SYY) has a market capitalization of $20.74 billion. The company employs 47,800 people, generates revenue of $42.380 billion and has a net income of $1.121 billion. The firm’s earnings before interest, taxes, depreciation and amortization (EBITDA) amounts to $2.332 billion. The EBITDA margin is 5.50 percent (the operating margin is 4.46 percent and the net profit margin 2.65 percent).
Financial Analysis: The total debt represents 24.96 percent of the company’s assets and the total debt in relation to the equity amounts to 64.43 percent. Due to the financial situation, a return on equity of 23.89 percent was realized. Twelve trailing months earnings per share reached a value of $1.73. Last fiscal year, the company paid $1.07 in the form of dividends to shareholders. The SYY stake purchase had an influence of 0.34 percent to his portfolio. The position is currently 8 percent in gain.
Market Valuation: Here are the price ratios of the company: The P/E ratio is 20.24, the P/S ratio is 0.49 and the P/B ratio is finally 4.37. The dividend yield amounts to 3.20 percent and the beta ratio has a value of 0.66.


E I Du Pont De Nemours (DD) has a market capitalization of $49.62 billion. The company employs 70,000 people, generates revenue of $35.310 billion and has a net income of $2.493 billion. The firm’s earnings before interest, taxes, depreciation and amortization (EBITDA) amounts to $6.358 billion. The EBITDA margin is 18.01 percent (the operating margin is 8.82 percent and the net profit margin 7.06 percent).
Financial Analysis: The total debt represents 23.60 percent of the company’s assets and the total debt in relation to the equity amounts to 116.38 percent. Due to the financial situation, a return on equity of 27.00 percent was realized. Twelve trailing months earnings per share reached a value of $2.60. Last fiscal year, the company paid $1.70 in the form of dividends to shareholders. The DD stake purchase had an influence of 0.3 percent to his portfolio. The position is currently 13 percent in gain.
Market Valuation: Here are the price ratios of the company: The P/E ratio is 20.76, the P/S ratio is 1.41 and the P/B ratio is finally 5.11. The dividend yield amounts to 3.34 percent and the beta ratio has a value of 1.55.


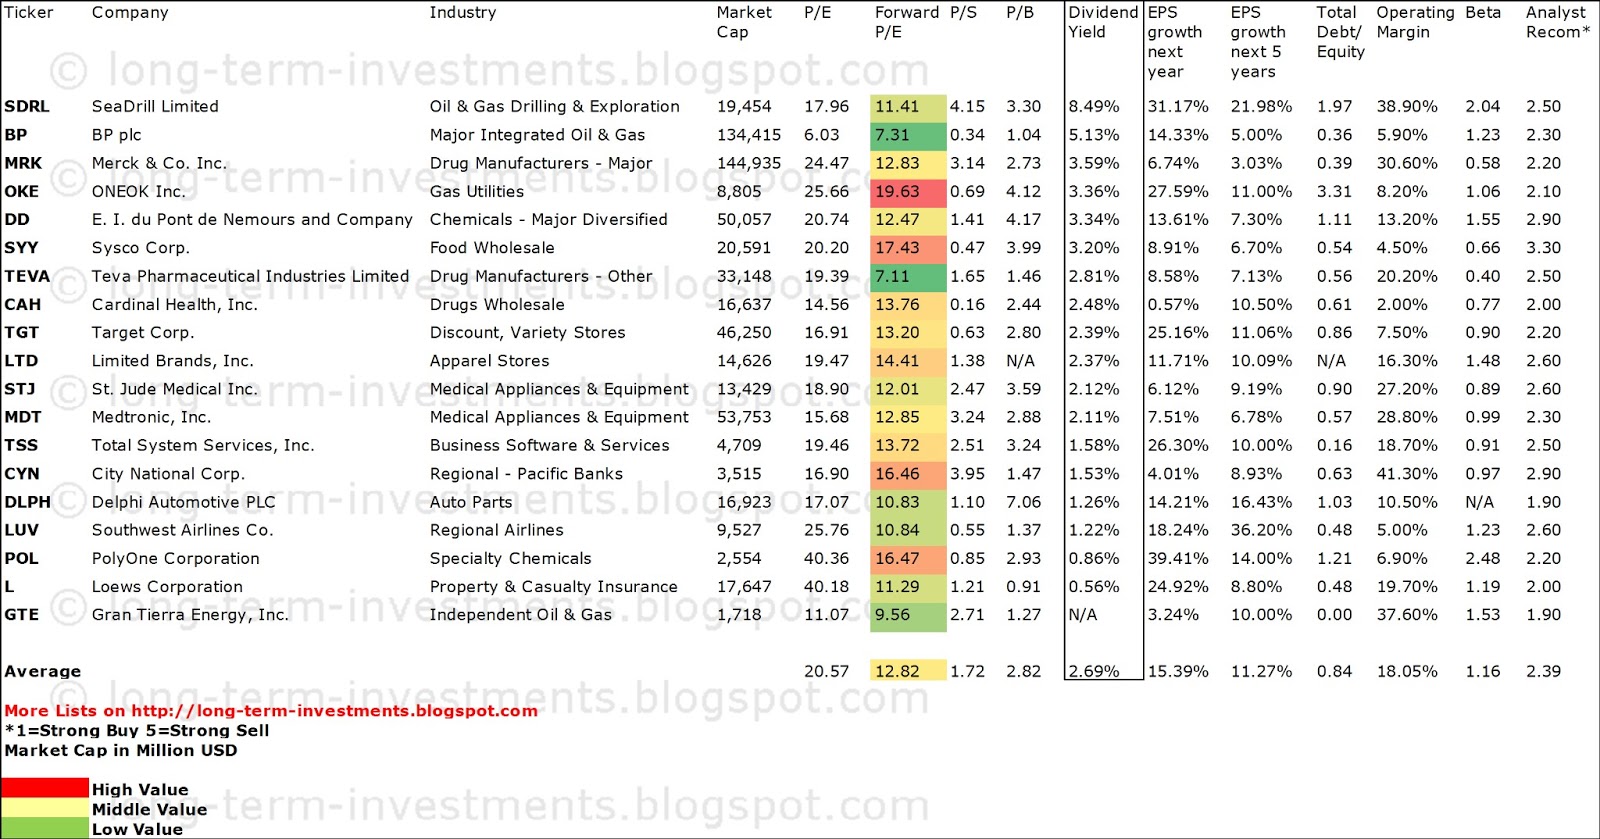
Take a closer look at the full list of the latest large dividend stock aqcuisitions from James Barrow and his biggest portfolio positions. The average P/E ratio amounts to 20.57 and forward P/E ratio is 12.82. The dividend yield has a value of 2.69 percent. Price to book ratio is 2.82 and price to sales ratio 1.72. The operating margin amounts to 18.05 percent and the beta ratio is 1.16. Stocks from the list have an average debt to equity ratio of 0.84.
These are the latest dividend stock buys from James Barrow, sorted by portfolio influence: -

Here is the full table with some fundamentals (TTM):
Here is the full table with some fundamentals (TTM): - See more at: http://long-term-investments.blogspot.in/2013/07/James-Barrows-Latest-Big-Dividend-Stock-Buys.html?utm_source=feedburner&utm_medium=feed&utm_campaign=Feed:+Long-Term-Investors+(Dividend+Yields)#sthash.pbmOYU6f.dpuf
Related stock ticker symbols:
SDRL, BP, MRK, OKE, DD, SYY, TEVA, CAH, TGT, LTD, STJ, MDT, TSS, CYN, DLPH,
LUV, POL, L, GTE
Disclosure: I am long SYY, MDT. I receive no compensation to write about these specific stocks, sector or theme. I don't plan to increase or decrease positions or obligations within the next 72 hours.
For the other stocks: I have no positions in any stocks mentioned, and no plans to initiate any positions within the next 72 hours. I receive no compensation to write about any specific stock, sector or theme.
Barrow is also a large cap dividend stock lover. Nearly all of his 20 most recent large cap stock acquisitions pay dividends. His biggest position is the tobacco company Philip Morris.
Merck (MRK) has a market capitalization of $144.82 billion. The company employs 82,000 people, generates revenue of $47.267 billion and has a net income of $6.299 billion. The firm’s earnings before interest, taxes, depreciation and amortization (EBITDA) amounts to $22.343 billion. The EBITDA margin is 47.27 percent (the operating margin is 18.49 percent and the net profit margin 13.33 percent).
Financial Analysis: The total debt represents 19.38 percent of the company’s assets and the total debt in relation to the equity amounts to 38.79 percent. Due to the financial situation, a return on equity of 11.47 percent was realized. Twelve trailing months earnings per share reached a value of $1.96. Last fiscal year, the company paid $1.68 in the form of dividends to shareholders. The MRK stake purchase had an influence of 0.99 percent to his portfolio. The position is currently 12 percent in gain.
Market Valuation: Here are the price ratios of the company: The P/E ratio is 24.44, the P/S ratio is 3.06 and the P/B ratio is finally 2.74. The dividend yield amounts to 3.59 percent and the beta ratio has a value of 0.58.
BP (BP) has a market capitalization of $133.86 billion. The company employs 85,700 people, generates revenue of $388.285 billion and has a net income of $11.816 billion. The firm’s earnings before interest, taxes, depreciation and amortization (EBITDA) amounts to $39.891 billion. The EBITDA margin is 10.27 percent (the operating margin is 5.08 percent and the net profit margin 3.04 percent).
Financial Analysis: The total debt represents 16.26 percent of the company’s assets and the total debt in relation to the equity amounts to 41.21 percent. Due to the financial situation, a return on equity of 10.07 percent was realized. Twelve trailing months earnings per share reached a value of $6.99. Last fiscal year, the company paid $1.98 in the form of dividends to shareholders. The BP stake purchase had an influence of 0.76 percent to his portfolio. The position is currently 1 percent in loss.
Market Valuation: Here are the price ratios of the company: The P/E ratio is 6.03, the P/S ratio is 0.34 and the P/B ratio is finally 1.13. The dividend yield amounts to 4.99 percent and the beta ratio has a value of 1.23.
SYSCO (SYY) has a market capitalization of $20.74 billion. The company employs 47,800 people, generates revenue of $42.380 billion and has a net income of $1.121 billion. The firm’s earnings before interest, taxes, depreciation and amortization (EBITDA) amounts to $2.332 billion. The EBITDA margin is 5.50 percent (the operating margin is 4.46 percent and the net profit margin 2.65 percent).
Financial Analysis: The total debt represents 24.96 percent of the company’s assets and the total debt in relation to the equity amounts to 64.43 percent. Due to the financial situation, a return on equity of 23.89 percent was realized. Twelve trailing months earnings per share reached a value of $1.73. Last fiscal year, the company paid $1.07 in the form of dividends to shareholders. The SYY stake purchase had an influence of 0.34 percent to his portfolio. The position is currently 8 percent in gain.
Market Valuation: Here are the price ratios of the company: The P/E ratio is 20.24, the P/S ratio is 0.49 and the P/B ratio is finally 4.37. The dividend yield amounts to 3.20 percent and the beta ratio has a value of 0.66.
E I Du Pont De Nemours (DD) has a market capitalization of $49.62 billion. The company employs 70,000 people, generates revenue of $35.310 billion and has a net income of $2.493 billion. The firm’s earnings before interest, taxes, depreciation and amortization (EBITDA) amounts to $6.358 billion. The EBITDA margin is 18.01 percent (the operating margin is 8.82 percent and the net profit margin 7.06 percent).
Financial Analysis: The total debt represents 23.60 percent of the company’s assets and the total debt in relation to the equity amounts to 116.38 percent. Due to the financial situation, a return on equity of 27.00 percent was realized. Twelve trailing months earnings per share reached a value of $2.60. Last fiscal year, the company paid $1.70 in the form of dividends to shareholders. The DD stake purchase had an influence of 0.3 percent to his portfolio. The position is currently 13 percent in gain.
Market Valuation: Here are the price ratios of the company: The P/E ratio is 20.76, the P/S ratio is 1.41 and the P/B ratio is finally 5.11. The dividend yield amounts to 3.34 percent and the beta ratio has a value of 1.55.
Take a closer look at the full list of the latest large dividend stock aqcuisitions from James Barrow and his biggest portfolio positions. The average P/E ratio amounts to 20.57 and forward P/E ratio is 12.82. The dividend yield has a value of 2.69 percent. Price to book ratio is 2.82 and price to sales ratio 1.72. The operating margin amounts to 18.05 percent and the beta ratio is 1.16. Stocks from the list have an average debt to equity ratio of 0.84.
These are the latest dividend stock buys from James Barrow, sorted by portfolio influence: -
Here is the full table with some fundamentals (TTM):
Here is the full table with some fundamentals (TTM): - See more at: http://long-term-investments.blogspot.in/2013/07/James-Barrows-Latest-Big-Dividend-Stock-Buys.html?utm_source=feedburner&utm_medium=feed&utm_campaign=Feed:+Long-Term-Investors+(Dividend+Yields)#sthash.pbmOYU6f.dpuf
Related stock ticker symbols:
SDRL, BP, MRK, OKE, DD, SYY, TEVA, CAH, TGT, LTD, STJ, MDT, TSS, CYN, DLPH,
LUV, POL, L, GTE
Disclosure: I am long SYY, MDT. I receive no compensation to write about these specific stocks, sector or theme. I don't plan to increase or decrease positions or obligations within the next 72 hours.
For the other stocks: I have no positions in any stocks mentioned, and no plans to initiate any positions within the next 72 hours. I receive no compensation to write about any specific stock, sector or theme.