
Johnson & Johnson (NYSE:JNJ) reported mixed second-quarter 2017 results. While earnings beat expectations, sales missed the same. However, the drug and consumer products giant raised its 2017 sales and profit outlook, which sent shares up more than 1% in pre-market trading.
This year so far, J&J’s share price is up 14.7%. This compares favorably with the 11.3% increase witnessed by the Zacks classified Large-Cap Pharma industry.

Earnings Beat
J&J’s second-quarter 2017 earnings came in at $1.83 per share, beating the Zacks Consensus Estimate of $1.79 and increasing 5.2% from the year-ago period.
Including one-time items, J&J reported second-quarter earnings of $1.40 per share, down 2.1% from the year-ago period.
Sales Miss Again
Sales came in at $18.84 billion, missing the Zacks Consensus Estimate of $18.89 billion by 0.3%. Sales increased 1.9% from the year-ago quarter, reflecting an operational increase of 2.9% and a negative currency impact of 1%. Organically, excluding the impact of acquisitions and divestitures, sales increased 0.5% on an operational basis.
Second-quarter sales grew 1.6% in the domestic market to $9.73 billion and 2.3% in international markets to $9.11 billion, reflecting 4.4% operational growth, partially offset by a 2.1% negative currency impact.
Sales in Details
Pharmaceutical segment sales declined 0.2% year over year to $8.64 billion, reflecting 1% operational growth and 1.2% negative currency impact. Higher sales in international markets offset a weaker performance in the U.S.
Sales in the domestic market declined 2.6% to $5.01 billion, while international sales grew 3.3% to $3.63 billion.
New products like Imbruvica (cancer) and Darzalex (multiple myeloma) continued to perform well. Other growth drivers were Xarelto, Stelara and Invega Sustenna.
However, sales of Invokana/Invokamet declined 23%. Also, Concerta declined 23.9% while Zytiga sales fell 7.2%.
Importantly, sales of the blockbuster rheumatoid arthritis drug Remicade, marketed in partnership with Merck & Co., Inc. (NYSE:MRK) , declined 14% in the quarter with U.S. sales declining 13.9% and international sales declining 5.6% due to biosimilar competition. In this regard, we would like to mention that Pfizer Inc. (NYSE:PFE) launched its Inflectra injection, a biosimilar version of Remicade in the U.S. late last November. This did not have any significant impact on Remicade sales in the past two quarters. Management is expected to comment on the impact of the biosimilar on second-quarter sales at the conference call.
J&J’s Pharma segment achieved some clinical milestones during the quarter. These included the FDA approval for Darzalex to be used in combination with Celgene Corporation’s (NASDAQ:CELG) Pomalyst (pomalidomide) and dexamethasone for the third-line treatment of multiple myeloma. Importantly, last week, J&J announced FDA approval for its pipeline candidate guselkumab for the treatment of moderate-to-severe plaque psoriasis. The drug will be marketed by the trade name of Tremfya.
Meanwhile, last month J&J completed its previously announced $30 billion acquisition of Swiss biotech Actelion, which will diversify its revenuesto the pulmonary arterial hypertension (PAH) category. Actelion’s PAH drugs added $91 million to the top line in the quarter.
Medical Devices segment sales came in at $6.73 billion, up 4.9% from the year-ago period. It included an operational increase of 5.9% and negative currency movement of 1%. Sales gained mainly from the inclusion of Abbott Medical Optics acquisition. Excluding the impact of all acquisitions and divestitures, on an operational basis, worldwide sales increased 1.1%.
Sales in the domestic market rose 6.1% year over year to $3.23 billion. International market sales increased 3.9% (operational increase of 5.8%) year over year to $3.5 billion.
Operational growth was driven by the Advanced Surgery business; electrophysiology products in the Cardiovascular business and Acuvue contact lenses in the Vision Care business, which made up for a weaker sales performance in the Diabetes Care unit
The Consumer segment recorded revenues of $3.48 billion in the reported quarter, up 1.7% year over year(operational increase of 2.3%). Foreign currency movement negatively impacted sales in the segment by 0.6%. Sales in the domestic market grew 7.4% from the year-ago period to $1.49 billion.
Slower growth in baby care products was partially offset by growth in over-the-counter products.
Meanwhile, the international segment recorded a decline of 2.2% to $1.99 billion, reflecting an operational decline of 1.1% and a negative currency impact of 1.1%.
2017 Guidance Raised
J&J raised its earnings guidance for 2017 and increased the lower end of its sales outlook.
J&J expects 2017 adjusted earnings per share in the range of $7.12 - $7.22, including currency impact, compared with $7.00 - $7.15 expected previously.
The revenue guidance is in the range of $75.8 billion to $76.1 billion compared with $75.4 billion to $76.1 billion expected previously
Our Take
Despite the third consecutive sales miss, J&J looks optimistic about a better sales performance in the second half. Chief executive officer, Alex Gorsky said that J&J’s sales growth will accelerate in the second half of the year.
Importantly, sales in the Medical Device segment are picking up, which made up for lower sales in the international Consumer and U.S. Pharmaceutical segments in the quarter. Sales in J&J’s domestic Pharma segment have decelerated this year as key growth drivers have slowed down due to competition. Quite a few products in its portfolio like Remicade and Concerta are facing generic competition. However, we believe that new products like Tremfya, label expansion of drugs like Imbruvica and Darzalex and contribution from Actelion could lead to better sales trends in the remaining half of the year.
J&J carries a Zacks Rank #3 (Hold). You can see the complete list of today’s Zacks #1 Rank (Strong Buy) stocks here.
Johnson & Johnson Price, Consensus and EPS Surprise
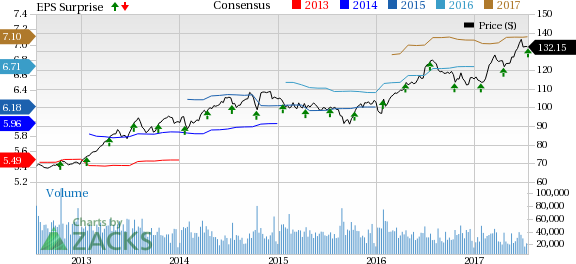
Johnson & Johnson Price, Consensus and EPS Surprise | Johnson & Johnson Quote
5 Trades Could Profit "Big-League" from Trump Policies
If the stocks above spark your interest, wait until you look into companies primed to make substantial gains from Washington's changing course.
Today Zacks reveals 5 tickers that could benefit from new trends like streamlined drug approvals, tariffs, lower taxes, higher interest rates, and spending surges in defense and infrastructure. See these buy recommendations now >>
Pfizer, Inc. (PFE): Free Stock Analysis Report
Johnson & Johnson (JNJ): Free Stock Analysis Report
Merck & Company, Inc. (MRK): Free Stock Analysis Report
Celgene Corporation (CELG): Free Stock Analysis Report
Original post
Zacks Investment Research