
Shares of J. C. Penney Company, Inc. (NYSE:JCP) plummeted nearly 5% during the trading session on Feb 27 despite reporting better-than-expected results for fourth-quarter fiscal 2019. We note that both revenues and earnings declined year over year. Also, the company continues to witness soft comparable store sales (comps). Management issued a dismal comps view for fiscal 2020, calling for a decline of 3.5-4.5%.
Over the past three months, the Plano, TX-based company has seen its shares plunge 38.7%, wider than the industry’s 13.4% decline.

Nevertheless, some of the highlights of the fourth quarter include improvement in cost of goods sold and gross margin expansion. Notably, gross margin expanded 200 basis points (bps) in fiscal fourth quarter, marking the third straight quarter of significant growth. Management expects strength in the women’s apparel business to continue. Moving on, this Zacks Rank #3 (Hold) company’s turnaround efforts, including the implementation of Plan for Renewal, bode well.
Let’s Analyze the Results
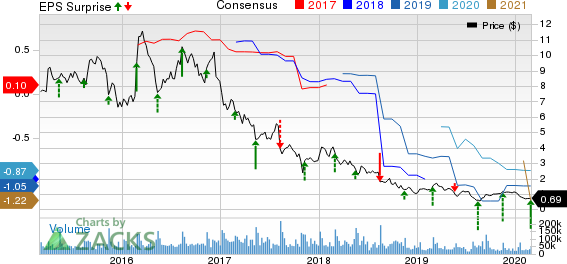
The company posted adjusted earnings of 13 cents in the fiscal fourth quarter against the Zacks Consensus Estimate of a loss of 8 cents. However, the reported figure showcases a decline of 27.8% from 18 cents earned in the year-ago quarter.
Total revenues (including total net sales, and credit income and other) in the quarter were $3,493 million, down 7.7% from the prior-year quarter. However, the metric beat the Zacks Consensus Estimate of $3,442 million. This marked a sales beat after three consecutive quarters of a miss.
Moreover, total quarterly net sales of $3,384 million fell 7.7% year over year owing to soft comps performance. We note that the company made aggressive promotions to liquidate slow-moving and aged inventory in the year-ago quarter.
Comps in the quarter declined 7% year over year. This can be attributed to the company’s exit from major appliance and in-store furniture categories, which impacted comps to the tune of 230 basis points (bps). These exits were carried out as part of the company’s turnaround initiatives to focus on profitable areas. Further, adjusted comps declined 4.7% in the quarter under review.
Nevertheless, six of the company’s eight merchandize divisions’ comps improved in the second half of fiscal 2019 over the first half. Categories such as women’s apparel, women’s accessories, footwear and home witnessed notable improvements. Further, credit income and others totaled $109 million, down 9.9% on a year-over-year basis.
Cost of goods sold was $2,257 million, down 10.4% from the prior-year quarter’s figure. As a percentage of net sales, the metric improved 200 bps to 66.7%, courtesy of improved shrink performance and higher enterprise clearance selling margins from lower permanent markdowns as well as the exit of major appliance and in-store furniture categories this year.
Furthermore, adjusted EBITDA fell 8.6% to $243 million. However, SG&A expenses dropped 0.2% to $1,005 million. We note that the company realized savings in controllable expenses, which compensated higher incentive compensation and home office lease costs. As percentage of net sales, SG&A expenses increased 220 bps to 29.7%.
J. C. Penney Company, Inc. Price, Consensus and EPS Surprise
J. C. Penney Company, Inc. price-consensus-eps-surprise-chart | J. C. Penney Company, Inc. Quote
Other Financial Details
J. C. Penney ended fiscal 2019 with cash and cash equivalents of $386 million compared with $333 million in the year-ago period. Meanwhile, long-term debt was $3,574 million, down 3.8% from the year-ago quarter’s figure. Shareholders’ equity totaled $829 million at the end of fiscal 2019. Merchandise inventory levels declined 11.1% to $2,166 million.
During fiscal 2019, the company repaid debt of $97 million, which included $50 million of unsecured notes paid at maturity.
The company had free cash flow of $145 million in fiscal 2019. Further, during this period it incurred capital expenditure of $309 million.
Store Update
J. C. Penney ended fiscal 2019 with 846 stores. Of these, roughly 72% are mall-based while the balance 28% is off-mall locations. Moreover, the company closed 18 full-line stores this fiscal.
During the next fiscal, management expects to shut down a minimum of six stores. Including these stores, the company has shuttered 173 stores since the start of fiscal 2017.
Outlook
Management issued a view for fiscal 2020, which includes the impact of the currently-imposed China tariff but excludes the effect of coronavirus. J. C. Penney projects an improvement of 100-130 bps in cost of goods sold (as a percentage of net sales), which is likely to result in gross margin expansion by an equivalent basis point. Depreciation and amortization is likely to be roughly $515 million for fiscal. It anticipates net interest expense of about $290 million.
Moving on, the company expects adjusted EBITDA growth of 5-10% over $583 million recorded in fiscal 2019. Management estimates positive free cash flow for the fiscal year. Capital expenditures for fiscal 2020 are forecasted at $300 million.
Key Picks in Retail
Stitch Fix (NASDAQ:SFIX) has an impressive long-term expected earnings growth rate of 15% and currently sports a Zacks Rank #1 (Strong Buy). You can see the complete list of today’s Zacks #1 Rank stocks here.
Zumiez (NASDAQ:ZUMZ) , also a Zacks Rank #1 stock, has an expected long-term earnings growth rate of 12%
Macy's (NYSE:M) has a long-term earnings growth rate of 7.5% and a Zacks Rank #2 (Buy).
5 Stocks Set to Double
Each was hand-picked by a Zacks expert as the #1 favorite stock to gain +100% or more in 2020. Each comes from a different sector and has unique qualities and catalysts that could fuel exceptional growth.
Most of the stocks in this report are flying under Wall Street radar, which provides a great opportunity to get in on the ground floor.
Today, See These 5 Potential Home Runs >>
J. C. Penney Company, Inc. (JCP): Free Stock Analysis Report
Zumiez Inc. (ZUMZ): Free Stock Analysis Report
Macy's, Inc. (M): Free Stock Analysis Report
Stitch Fix, Inc. (SFIX): Free Stock Analysis Report
Original post
Zacks Investment Research