Get 40% Off
🚨 Volatile Markets? Find Hidden Gems for Serious OutperformanceFind Stocks Now

Core Market Health Indicators Hammered After Rough Week

Published 01/17/2016, 01:27 AM
Updated 07/09/2023, 06:31 AM

Wow. What a week. Like the market all of my core health indicators got hammered. They are now all deep in negative territory. I’ll let the chart speak for itself.
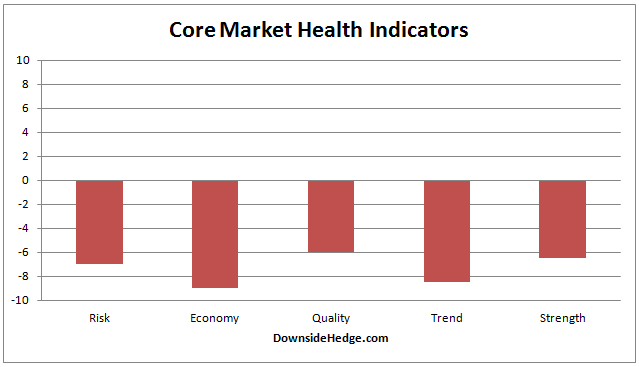
Core Market Health Indicators

One thing of note is that my market risk indicator is now signalling. This changes the volatility hedged portfolio to 50% long and 50% hedged with mid term volatility (an ETF/ETN like N:VXZ) or dynamic volatility (N:XVZ).

For official tracking purposes I use XVZ, but the instrument is thinly traded so it introduces problems in actual portfolio management. First is that thin trading means it is difficult to fill large trades at a good “market” price. Second is that in a swiftly declining market the bid may as much as 20% below the market so you’ll have difficulty getting out of the position (or rebalancing) when pure panic has set in. As a result, I personally use mid term volatility like VXZ instead of dynamic volatility. But, since the back test has been done with XVZ I’ll continue to use it for official tracking purposes… for now. At some point I’ll reevaluate and decide if VXZ should be used instead. As always, you need to pick a hedging instrument that you understand and fits your personal risk tolerance.

With the signal from my market risk indicator it changes the hedge for the Long / Short portfolio from a short of the S&P 500 Index (or the ETF N:SH) to mid term volatility (VXZ). So the new Long / Short portfolio allocation is now 50% long high beta stocks and 50% hedged with VXZ (or a similar instrument).

3rd party Ad. Not an offer or recommendation by Investing.com. See disclosure here or remove ads .

From a Dow Theory perspective we’re at a critical point. If the Dow Jones Industrial Average (DJIA) closes below 15666 we’ll be officially in a long term bear market. I’ll write more about that if/when it happens.
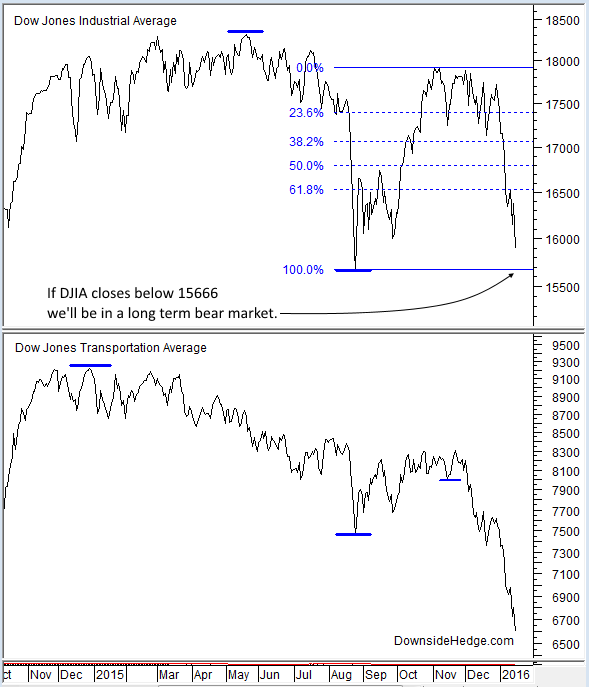
Dow Theory Chart

Latest comments

Risk Disclosure: Trading in financial instruments and/or cryptocurrencies involves high risks including the risk of losing some, or all, of your investment amount, and may not be suitable for all investors. Prices of cryptocurrencies are extremely volatile and may be affected by external factors such as financial, regulatory or political events. Trading on margin increases the financial risks.
Before deciding to trade in financial instrument or cryptocurrencies you should be fully informed of the risks and costs associated with trading the financial markets, carefully consider your investment objectives, level of experience, and risk appetite, and seek professional advice where needed.
Fusion Media would like to remind you that the data contained in this website is not necessarily real-time nor accurate. The data and prices on the website are not necessarily provided by any market or exchange, but may be provided by market makers, and so prices may not be accurate and may differ from the actual price at any given market, meaning prices are indicative and not appropriate for trading purposes. Fusion Media and any provider of the data contained in this website will not accept liability for any loss or damage as a result of your trading, or your reliance on the information contained within this website.
It is prohibited to use, store, reproduce, display, modify, transmit or distribute the data contained in this website without the explicit prior written permission of Fusion Media and/or the data provider. All intellectual property rights are reserved by the providers and/or the exchange providing the data contained in this website.
Fusion Media may be compensated by the advertisers that appear on the website, based on your interaction with the advertisements or advertisers.
© 2007-2024 - Fusion Media Limited. All Rights Reserved.