
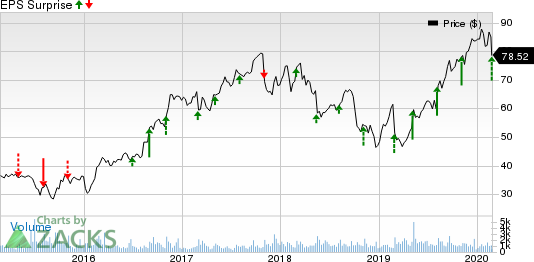
Itron, Inc. (NASDAQ:ITRI) reported fourth-quarter 2019 non-GAAP earnings of 72 cents per share, which beat the Zacks Consensus Estimate by 33.4%. However, the bottom line was down 18.2% from the year-ago quarter and 30.8% sequentially.
Revenues came in at $628.4 million, which surpassed the Zacks Consensus Estimate by 5.2%. Further, the top line improved 7% year over year or 8% on a constant-currency basis. The figure was also up 0.6% from the prior quarter.
The top line was driven by robust performance of the company’s Networked Solutions segment.
However, weak performance by Device Solutions and Outcomes segments remained concerns.
Further, product revenues were $556.6 million (88.6% of total revenues), up 7.7% year over year. Service revenues came in $71.8 million (11.4%), which improved 2.1% from the year-ago quarter.
The company’s bookings were $767 million and the backlog came in at $3.2 billion at the end of the reported quarter.
Following the better-than-expected fourth-quarter results, shares of the company have risen 4.2% in the pre-market trading.
The company remains optimistic regarding its strategic investments toward product innovation that will continue to drive customer momentum in the near term as well as the long run.
Further, Itron has gained 29.7% over a year, outperforming the industry’s rally of 4.7%.

Segments in Detail
Device Solutions: The company generated $206.1 million revenues (32.8% of total revenues) from this segment, down 9% from the year-ago quarter. This was primarily owing to decline in smart spec shipment volumes in the EMEA region during the reported quarter. Moreover, declining volumes offset the impact of strong performance in the water and gas markets.
Networked Solutions: Revenues from this segment came in $368.7 million (58.7% of total revenues), improved 21% year over year. This can primarily be attributed to solid demand for connected devices in North America. Further, shift in the timing of certain customer deployments in the fourth quarter, which were scheduled for the current quarter, drove the segment’s revenues.
Outcomes: This segment generated $53.6 million revenues (8.5% of total revenues), down 1% on a year-over-year basis. The company witnessed one-time customer adjustment that impacted the segment’s top line. Moreover, this negated accelerating services revenues in North America.
Operating Details
For the fourth quarter, Itron’s gross margin was 28.2%, which contracted 190 basis points (bps) on a year-over-year basis due to unfavorable product mix.
Non-GAAP operating expenses were $128.04 million, up 2.4% year over year. This decrease resulted from strong restructuring initiatives.
Further, non-GAAP operating margin came in 7.4%, contracting 90 bps from the year-ago quarter. This was attributable to rising product development investment.
Balance Sheet & Cash Flows
As of Dec 31, 2019, cash and cash equivalents totaled $149.9 million, up from $140.9 million as of Sep 30, 2019. Accounts receivables were $472.9 million, up from $468.5 million in the previous quarter.
Itron generated $45 million cash from operations in the fourth quarter compared with $50 million in the third quarter.
Moreover, the company generated free cash flow of $29 million, down from $32 million in the last quarter.
2020 Guidance
For 2020, management expects non-GAAP earnings within the range of $3.35-$3.85 per share. The Zacks Consensus Estimate for earnings is pegged at $3.56 per share.
Further, the company expects revenues between $2.475 million and $2.575 billion. The Zacks Consensus Estimate for revenues is projected at $2.52 billion.
Zacks Rank & Key Picks
Itron currently has a Zacks Rank #3 (Hold).
Some better-ranked stocks in the broader technology sector are Inphi Corporation (NYSE:IPHI) , Microchip Technology Incorporated (NASDAQ:MCHP) and Model N, Inc. (NYSE:MODN) , each sporting a Zacks Rank #1 (Strong Buy). You can see the complete list of today’s Zacks #1 Rank stocks here.
Long-term earnings growth rate for Inphi, Microchip and Model N is currently pegged at 38.74%, 13.28% and 13%, respectively.
The Hottest Tech Mega-Trend of All
Last year, it generated $24 billion in global revenues. By 2020, it's predicted to blast through the roof to $77.6 billion. Famed investor Mark Cuban says it will produce "the world's first trillionaires," but that should still leave plenty of money for regular investors who make the right trades early.
See Zacks' 3 Best Stocks to Play This Trend >>
Itron, Inc. (ITRI): Free Stock Analysis Report
Microchip Technology Incorporated (MCHP): Free Stock Analysis Report
Model N, Inc. (MODN): Free Stock Analysis Report
Inphi Corporation (IPHI): Free Stock Analysis Report
Original post
Zacks Investment Research