Get 40% Off
🚨 Volatile Markets? Find Hidden Gems for Serious OutperformanceFind Stocks Now

It Takes Days And Weeks To Knock The S&p Down And Only 1 To Bring It Back

Published 11/19/2017, 06:00 AM
Updated 05/14/2017, 06:45 AM

And Now Back To The Rally

I can’t say I am surprised. We have a trading rule at MrTopStep that says ‘it takes days and weeks to knock the S&P down and only one to bring it back.’ On Wednesday night I put this out in the MrTopStep forum:

Dboy:(7:45:51 PM): es going to rally tomorrow and Friday… going back to 2585-87.

I saw the futures start to rally, and all I could think of was how negative the crowd got over the last few days, and how far off base the shorts were. While there was some weakness in Asian and Europe, all the ongoing quantitative easing was not going to let the markets fall very much. What were the reasons the markets rallied so much? Japan’s Nikkei rallied 1.5%, taking back nearly all of Wednesday’s decline, and the Stoxx Europe 600 was up 0.8% after being down seven straight sessions, its longest losing streak in a year.

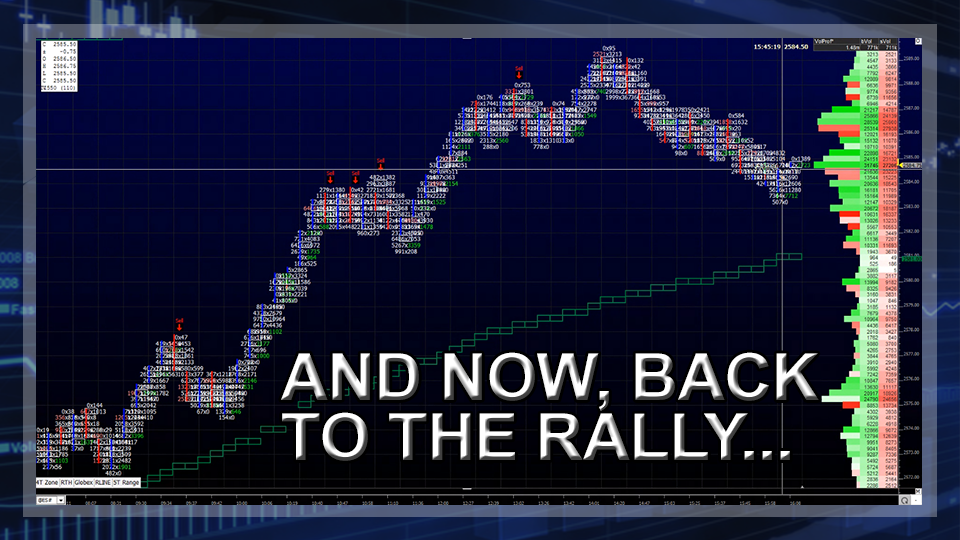
The first print off the 8:30 CT open was 2574.25, the overnight Globex range was 2575.75 to 2562.25, with 250k ES traded. After the open there was a small down tick to 2542.25, and then a rally up to 2577.00. After a pullback down to 2574.25 the ES shot up to 2580.25, then there was another a small down tick before the ES shot up to 2583.75.

Clearly, the train left the station. I know people think I am making fun of the shorts, but I’m really not. This is the same old price action we have been seeing for years. While there have been some bumps in the road, there have been very few extended selloffs. Sure, you see a few 1 and 2 day pullbacks, but when it gets to 3 to 5 day pullbacks they’re are few and far between. The other part, and something we should never forget, is all the ongoing quantitative easing and historically low interest rates which help create stock buybacks.

3rd party Ad. Not an offer or recommendation by Investing.com. See disclosure here or remove ads .

After a small pullback to the 2581 area, the ES rallied up to a new high at 2585.00 at 11:00 CT, traded 2587.50 at 11:55, 2588.00 at 1:15, and up to 2589.50 at 1:20 CT. In addition to the mammoth November options expiration squeeze, the House OK’d the GOP tax bill.

After rallying to new highs, the ES pulled back to 2585.25, and then several ES buy imbalances show up, helping push the futures back up to 2587.00. As the MiM went from $230 million to sell to $399 million to sell, the ES pulled back down to 2585.00 at 2:38. The ES bounced, and then sold off down to 2583.25 after the actual 2:45 NYSE Closing Imbalance showed a net sell of $-228 million. On the 3:00 futures close the ES settled at 2585.00, up +20 handles.

  • In Asia 8 out of 11 markets closed higher: Shanghai Comp -0.50%, Hang Seng +0.62%, Nikkei +0.20%
  • In Europe 8 out of 12 markets are trading lower: CAC +0.13%, DAX +0.20%, FTSE +0.08%
  • Fair Value: S&P -0.72, NASDAQ +4.77, Dow -28.31
  • Total Volume: 1.5mil ESZ & 934 SPZ traded in the pit

Original post

Latest comments

Until it doesn't
Risk Disclosure: Trading in financial instruments and/or cryptocurrencies involves high risks including the risk of losing some, or all, of your investment amount, and may not be suitable for all investors. Prices of cryptocurrencies are extremely volatile and may be affected by external factors such as financial, regulatory or political events. Trading on margin increases the financial risks.
Before deciding to trade in financial instrument or cryptocurrencies you should be fully informed of the risks and costs associated with trading the financial markets, carefully consider your investment objectives, level of experience, and risk appetite, and seek professional advice where needed.
Fusion Media would like to remind you that the data contained in this website is not necessarily real-time nor accurate. The data and prices on the website are not necessarily provided by any market or exchange, but may be provided by market makers, and so prices may not be accurate and may differ from the actual price at any given market, meaning prices are indicative and not appropriate for trading purposes. Fusion Media and any provider of the data contained in this website will not accept liability for any loss or damage as a result of your trading, or your reliance on the information contained within this website.
It is prohibited to use, store, reproduce, display, modify, transmit or distribute the data contained in this website without the explicit prior written permission of Fusion Media and/or the data provider. All intellectual property rights are reserved by the providers and/or the exchange providing the data contained in this website.
Fusion Media may be compensated by the advertisers that appear on the website, based on your interaction with the advertisements or advertisers.
© 2007-2024 - Fusion Media Limited. All Rights Reserved.