In some ways, volatility can be compared to the weather. The level of volatility is rarely ‘just right’ and you never have to look too far to find complaints that ‘volatility is dead’ or simply ‘too high’.
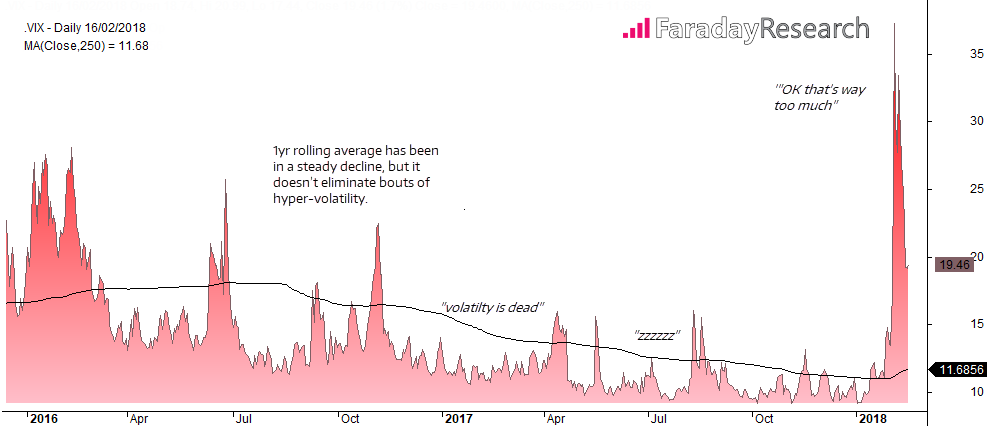
The recent rise of the VIX would be a case in point. It caught many by surprise when it morphed from being ‘too low for too long’ to being just downright silly high. And here we are again, just several sessions later, wishing volatility was indeed back.

Admittedly it has been a quiet start to the week, but this can be expected following a 3-day weekend in the US and China. But now liquidity is returning, and several key data points are approaching (UK earnings, employment and FOMC minutes to name a few) we are confident volatility will return. But there’s a more important reason than that.
Jekyll meet Hyde, Hyde meet Jekyll.
Volatility in isolation may be non-directional, but its bipolar nature means it has a predictable quality about it. We know volatility must alternate between low and high in much the same way day and night alternate. And whilst we may not know in advance to what degree volatility will revert to, its’ cyclical pattern between low and high is enough to better position ourselves for a trade.

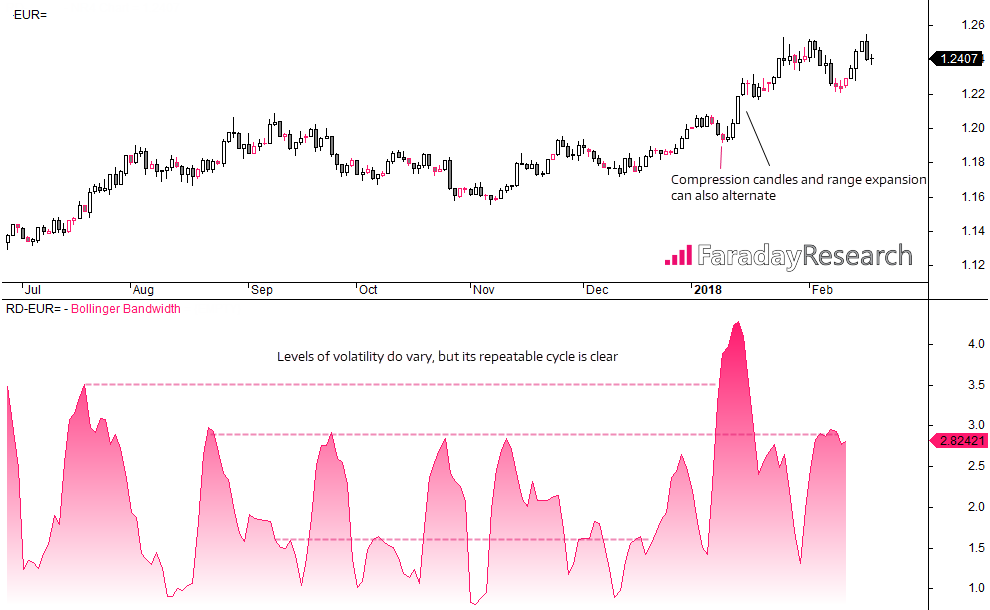
To demonstrate the volatility cycle, we’ve used Bollinger Band width alongside price action of EUR/USD. We chose this indicator with aesthetics in mind as the cycles appear more pronounced, but the theory applies to other volatility indicators such as ATR etc. Additionally, we have displaced the indicator back 10 bars (half its cycle length) to try and eliminate the lag caused by its underlying average. We should note that displacing the indicator makes it unusable for real-time application, but it helps underscore the theory.
The rhythm of the cycle is surprisingly clear in this example but there are times when they are less pronounced. Moreover, the level it moves to next can change seemingly without warning. But the cycle is there none the less, and if we are to combine this knowledge with trend and momentum analysis, we can only hope to time a better entry with our trades. You’ll notice we’ve also included narrow-range candles on EUR/USD, as bars can also exhibit the volatility cycle. Whilst less pronounced than the indicator, there is a pattern between narrow-ranged candles and range expansion candles.
So if volatility is too explosive, instead of ‘chasing the dragon’ as the fear of missing out kicks in, wait for volatility to subside before using alternative methods to aid with direction. Alternatively, if you can identify a low volatility period, we should then be on the lookout for volatility to erupt in future. Again, we’d use our preferred analytical methods to define entry method or chosen direction.
So, if you find yourself wishing for the other side of the volatility-coin, perhaps it could help to change the way you look at it. Instead of focussing on the absolute level of a volatility (whether it be the VIX, ATR etc.) try to embrace the shift between the two states of volatility, as one leads to the other.
