
Israel Chemicals Ltd. (NYSE:ICL) logged earnings of 4 cents per share in fourth-quarter 2019, down from 6 cents in the year-ago quarter. Earnings per share were in line with the Zacks Consensus Estimate.
Revenues were $1,106 million for the reported quarter, down around 22% year over year.
During the reported quarter, the company completed the potash capacity upgrade of the Dead Sea facilities that reduced production in the quarter and affected its results. Moreover, the weak commodity fertilizer market environment and delay in the signing of a potash supply contract in China impacted its results.
Full-Year Results
Earnings for 2019 were 37 cents per share, down from 97 cents per share a year ago.
Revenues were $5.3 billion for the full year, down around 5% year over year.
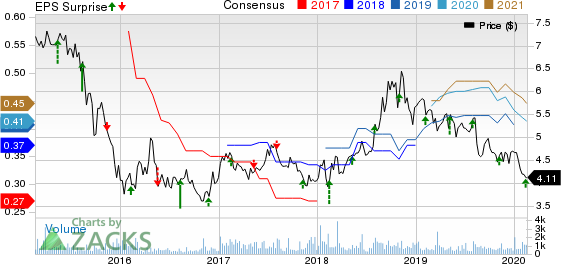
Israel Chemicals Shs Price, Consensus and EPS Surprise
Segment Highlights
Industrial Products: Revenues in the segment fell around 8% year over year to $293 million in the reported quarter, hurt by lower bromine production and sales volumes due to facility upgrade and associated shutdown at the Dead Sea and lower availability of chlorine, a key raw material for bromine production.
Potash: Revenues in the unit tumbled 41% to $302 million due to reduced potash production and sales volumes resulting from the Dead Sea facilities upgrade, lack of shipments to China due to the delay in the signing of new supply agreements and soft market conditions.
Phosphate Solutions: Revenues in the unit dropped 16% to $417 million, impacted by weakness in phosphate commodities.
Innovative Ag Solutions (IAS): Revenues in the IAS division were up 2% to $150 million, aided by increased prices and sales volumes in the Turf and Ornamental horticulture markets.
Financials
Israel Chemicals had cash and cash equivalents of $95 million at the end of 2019, down around 21% year over year. Long-term debt was $2,181 million, up around 20% year over year.
Operating cash flow was $992 million in 2019, up 60% year over year, driven by strong cash generation in the fourth quarter. Free cash flow was $446 million for the year, up nearly nine-fold year over year.
Outlook
Moving ahead, the company noted that the initiatives it has taken last year have considerably strengthened its position and prospects to create shareholder value for the years ahead. Israel Chemicals will increase its focus on developing innovative products, cost-effective processes and novel materials which it expects to create competitive advantages for the company.
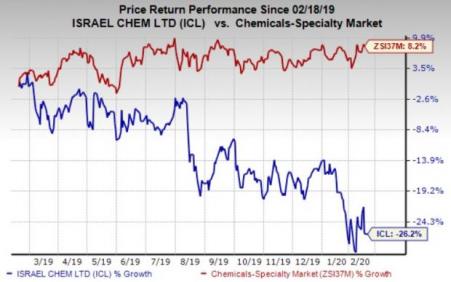
Price Performance
Israel Chemicals’ shares have lost around 26.2% in the past year against the industry’s 8.2% rise.
Zacks Rank & Key Picks
Israel Chemicals currently carries a Zacks Rank #4 (Sell).
Some better-ranked stocks in the basic materials space include Daqo New Energy Corp. (NYSE:DQ) , NovaGold Resources Inc. (NYSE:NG) and Sandstorm Gold Ltd. (NYSE:SAND) .
Daqo New Energy has projected earnings growth rate of 353.7% for 2020 and sports a Zacks Rank #1 (Strong Buy). The company’s shares have surged roughly 137% in a year’s time. You can see the complete list of today’s Zacks #1 Rank stocks here.
NovaGold has projected earnings growth rate of 11.1% for current fiscal and carries a Zacks Rank #1. The company’s shares have surged around 138% over a year.
Sandstorm Gold has estimated earnings growth rate of 66.7% for 2020 and carries a Zacks Rank #1. The company’s shares have shot up roughly 30% in a year’s time.
Today's Best Stocks from Zacks
Would you like to see the updated picks from our best market-beating strategies? From 2017 through 2019, while the S&P 500 gained and impressive +53.6%, five of our strategies returned +65.8%, +97.1%, +118.0%, +175.7% and even +186.7%.
This outperformance has not just been a recent phenomenon. From 2000 – 2019, while the S&P averaged +6.0% per year, our top strategies averaged up to +54.7% per year.
See their latest picks free >>
Sandstorm Gold Ltd (SAND): Free Stock Analysis Report
DAQO New Energy Corp. (DQ): Free Stock Analysis Report
Israel Chemicals Shs (ICL): Free Stock Analysis Report
Novagold Resources Inc. (NG): Free Stock Analysis Report
Original post
Zacks Investment Research