The iShares MSCI Global Impact ETF (NASDAQ:SDG) has been recently boosted by Tesla’s sustained bull run, with the exchange-traded fund (ETF) currently delivering a one-year 54% return on the back of the electric vehicle maker’s outstanding performance.
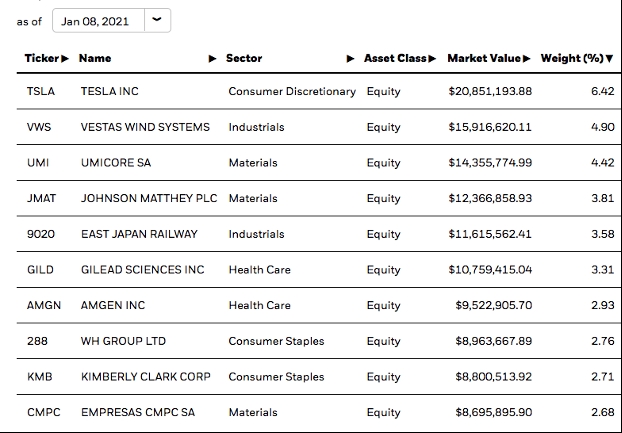
With Tesla (NASDAQ:TSLA) being the largest holding of this impact investing fund – currently accounting for 6.4% of its assets – the stock has contributed 609 basis points to its one-year performance, while other electric vehicle manufacturers including NIO (NYSE:NIO) and BYD (OTC:BYDDY)have also added another 2.14% and 1.12% during the same period.
That said, the fund exposure to Tesla’s latest parabolic trend could also play against its short-term performance if the price action suddenly turns in the opposite direction, especially after considering that weekly indicators are sitting at the most heavily extended levels on record for the stock.
A closer look at the iShares MSCI Global Impact ETF
The ETF is managed by iShare BlackRock with a total AUM of $324 million, and its investment philosophy aims to identify promising impactful companies whose goals aligning with the UN’s Sustainable Development Goals.
According to iShares, fund’s top 10 holdings currently account for 37.5% of its assets, which indicates that the fund is broadly diversified, while 52% of the companies that comprise the ETF are based in the United States (28%), Japan (14%), and China (10%).
Meanwhile, in terms of its sectoral composition, industrial, health care, and consumer staple businesses account for a total of 56% of the fund, followed by materials (12%) and consumer discretionary (11.5%).
Aside from Tesla, Vestas Wind Systems (OTC:VWDRY) has been another big winner for SDG during the past 12 months, with the stock contributing a 3.49% to the fund’s positive performance along with Samsung SDI (KS:006400) which added another 1.5%.
The fund was launched on April 20, 2016, and it has doubled its value since then, producing a 110% gain until December 31, 2020, outpacing the S&P 500 index by almost 30% although lagging behind the tech-heavy Nasdaq 100 index by nearly 73%.
Notably, according to data from ETF Database, the fund has received approximately $168 million in net inflows during the past 12 months amid growing interest from both retail and institutional investors toward impact investing vehicles with a CAGR of 27% between 2013 and 2019. That amount accounts for roughly 52% of the fund’s total assets to date.
Is Tesla as influential as it seems for SDG?
SDG’s diversified portfolio – currently comprised of 134 different holdings – seems to be able to cushion the impact of a sudden strong negative performance in one of its top individual components – i.e. Tesla.
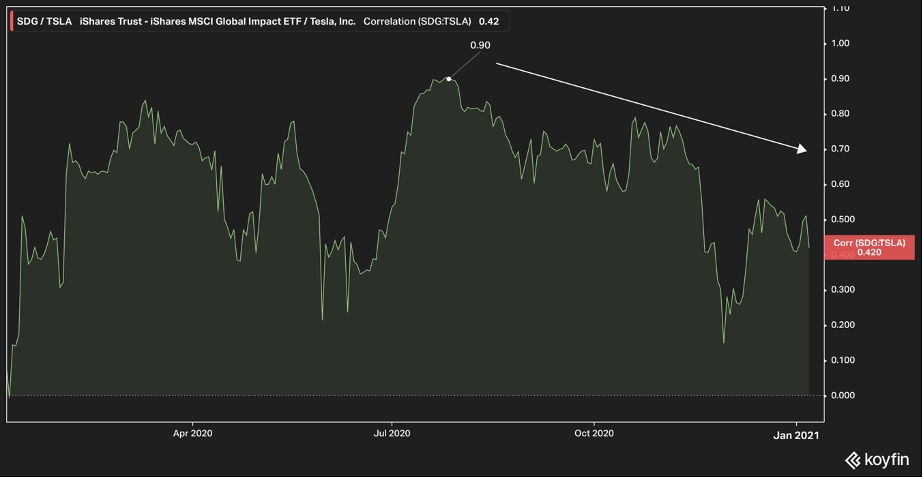
This is evidenced by the correlation between the fund’s performance and Tesla stock prices, which seems to be weakening, possibly since the fund has been cutting back its exposure on the electric vehicle maker amid its recent strong uptick.
The chart above shows how that correlation peaked at 0.9 on July 27 last year and has been progressively declining to its current level of 0.42, which makes the ETF less sensitive to any volatility of this individual stock.
However, the downside of the lower exposure means that the fund’s future gains are now more dependent on the positive performance of other stocks, which may or may not be as promising – or as volatile – as Tesla has been in the past year.
Technical analysis: RSI & MACD breakouts are signaling more upside ahead

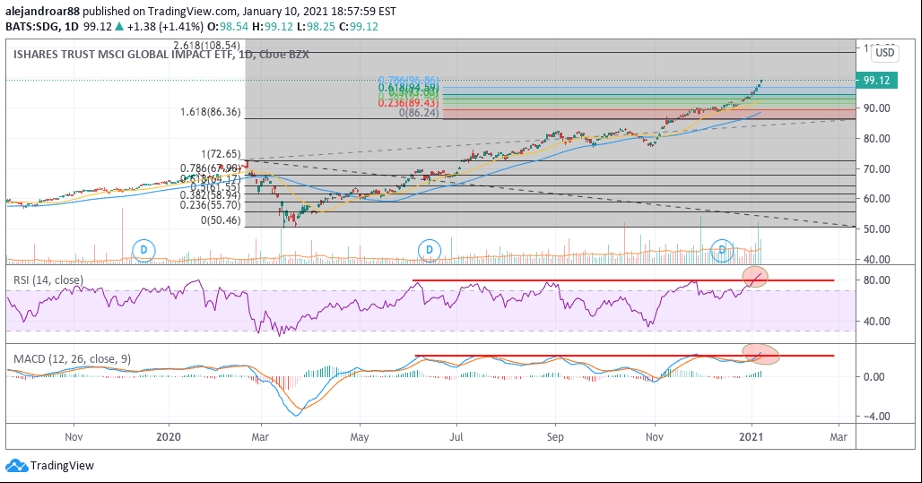
SDG’s latest price action has ended up breaking above a short-term target of $97 per share derived from the Fibonacci extension shown in the chart, with the ETF possibly heading to hit the 2.618 level of its February-March Fibonacci retracement.
Meanwhile, two interesting breakouts have been identified in the ETF’s RSI and MACD indicators, which show that the positive momentum is accelerating dramatically – a situation that could end up pushing the price to that 2.618 target of $108.5 per share.
Based on those targets, there is a potential 9% upside ahead based on the ETF’s last Friday closing price, although a pullback should be expected in short notice amid these overheated RSI and MACD readings.
If such a downturn is to happen, traders could ‘fish the bottom’ while expecting another future uptick after some profits are taken off the table.
Tesla and Vestas Wind Systems’ seemingly overextended bull runs could be the closest sources of downward momentum for the ETF right now, as the MACD readings for both stocks are currently at an all-time high while their RSI is either at or near the 80 level.
That said, given the diversified nature of the fund, other components may continue to support its positive performance despite a Tesla short-term downtick.
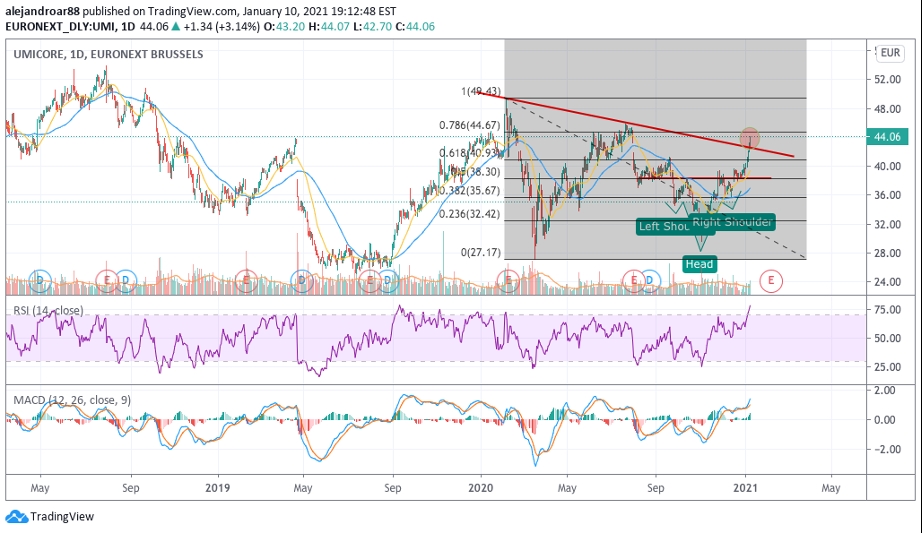
Notably, its third largest holding – Umicore (OTC:UMICY) – currently displays a realized bullish inverse head and shoulders formation with a potential target of $48 per share – a 10% short-term upside if accomplished – while the price action has already moved to the 0.618 Fibonacci level, signaling a strong upward momentum.
Based on its current 4.4% contribution to the fund, a realized 10% to 15% upside for Umicore could boost SDG’s price by around 2% to 2.5%, which could offset any strong downticks in Tesla and Vestas or, even better, the three could continue to rally higher, which would boost the ETF’s gains significantly over the coming weeks.
