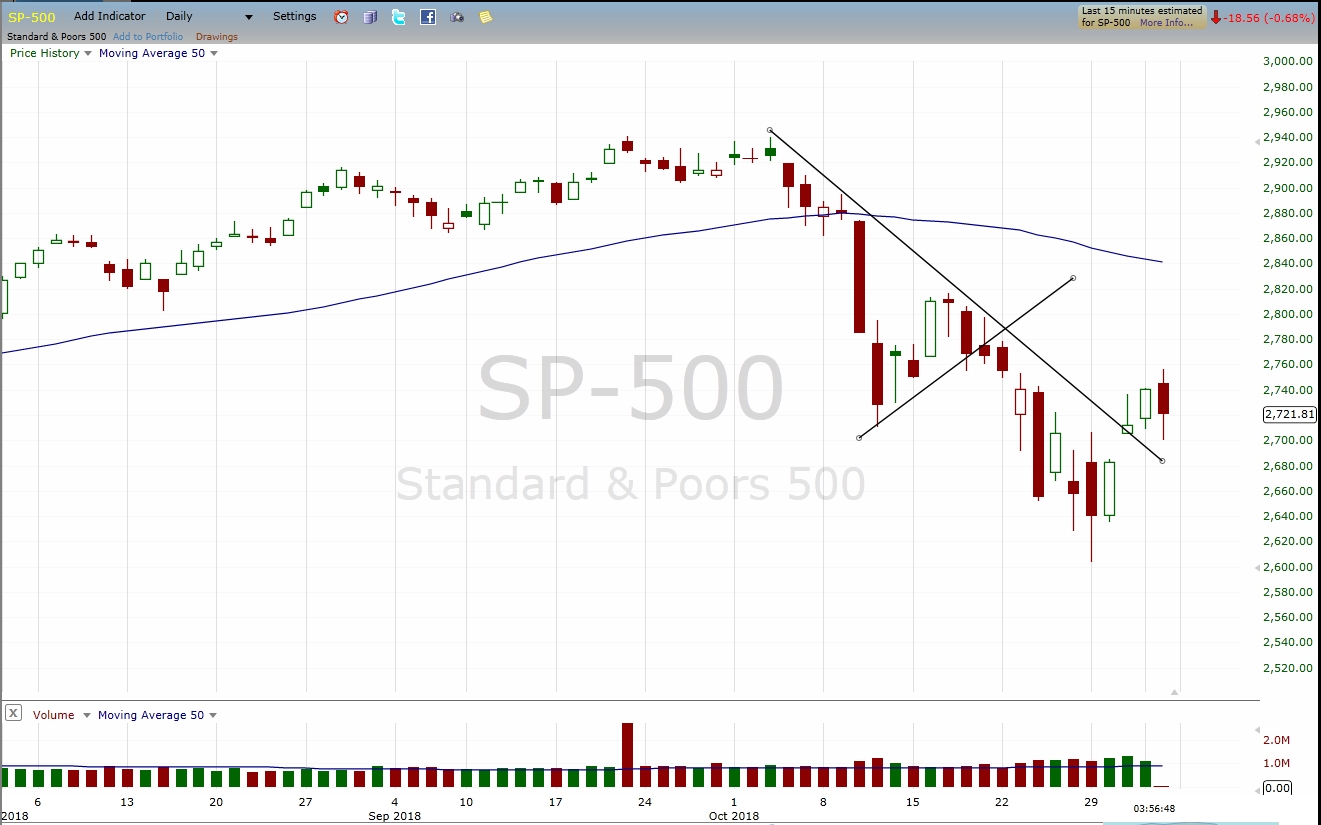
As we come to the end of October this last week, we saw a major shift in the bullish direction prices have been moving. Notice in the chart of the S&P 500 shown below that the price moved down from a $2939.86 to a low of $2603.54 in just 19 trading days. Another interesting thing about this move was the size of the daily candles. Notice how the size of the candles during these times were significantly larger than what we have seen in the past. This type of volatility has caused the market participants to become a bit nervous. There seems to be a fear that the markets may go into an extended down move. Whether or not this happen, we will want to make sure we are using good risk management in all your trades.
We are continuing to see the 50-period simple moving average move lower, while the price is trading below this line. The last couple of weeks we have looked at how the price dropped below the triangle lines that we drew in. This week we can see that the price has moved back above the top of the triangle line. This might indicate that the price is building some bullish strength. Any time we have prices breaking levels of support or resistance we need to consider a new direction coming into the market.
1. S&P 500:
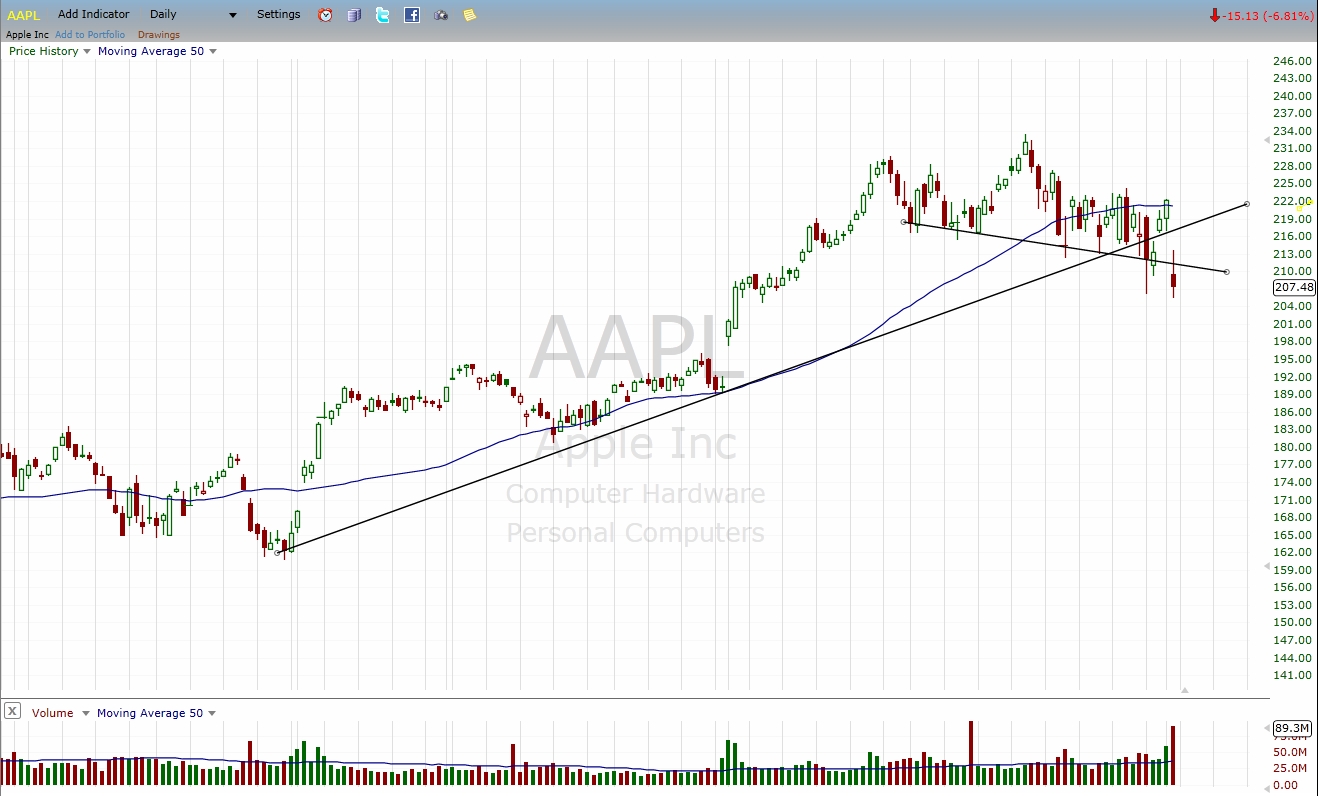
The next chart we want to look at is that of AAPL. With a less than great earnings report this week, we saw a strong bearish move happen. On Friday, the price dropped $14.75 which is a move lower of 6.64%. This is also a move below the recent support area. Take a look at the chart below.
Apple Inc (NASDAQ:AAPL):
There are a couple of elements that we should point out on this chart. First, the 50-period simple moving average has begun to move lower. This is a sign that the price is becoming more bearish. Second, the longer line which is moving higher and which has been acting as an area of longer-term support, has been broken to the down side. Third, we have also broken below the shorter support line. With these three things, we can reasonably suggest that the bears are beginning to take control of this stock. We will continue to monitor this next week to see if it can hold below these levels or if it bounces back up.
Finally, we are continuing to see the market put in these unusually wide-range trading sessions which is causing a bit of uncertainty in the markets. When the market trades like this, big up days followed by big down days, traders and investors become a bit fearful. This can often drive the markets even lower. While this can be concerning to traders, it can also open up good trading opportunities for those watching to take advantage of these moves. As you find these opportunities to enter into positions, make sure you are using the appropriate amount of risk, so you can handle any of the potential volatile movements that may happen.


