Breaking News
Investing Pro 0
Last Call for Cyber Monday! Save Now on Claim 60% OFF

Is Utilities Sector A Buy As It Climbs To All-Time Highs?

By Mike Zaccardi, CFA, CMTStock MarketsAug 23, 2022 05:25AM ET
www.investing.com/analysis/is-utilities-sector-a-buy-as-it-climbs-to-alltime-highs-200628830
Is Utilities Sector A Buy As It Climbs To All-Time Highs?
By Mike Zaccardi, CFA, CMT   |  Aug 23, 2022 05:25AM ET
Saved. See Saved Items.
This article has already been saved in your Saved Items
 
 
XLU
-0.81%
Add to/Remove from Watchlist
Add to Watchlist
Add Position

Position added successfully to:

Please name your holdings portfolio
 
SPY
-0.06%
Add to/Remove from Watchlist
Add to Watchlist
Add Position

Position added successfully to:

Please name your holdings portfolio
 
SO
-0.37%
Add to/Remove from Watchlist
Add to Watchlist
Add Position

Position added successfully to:

Please name your holdings portfolio
 
ETR
-1.04%
Add to/Remove from Watchlist
Add to Watchlist
Add Position

Position added successfully to:

Please name your holdings portfolio
 
NRG
+0.15%
Add to/Remove from Watchlist
Add to Watchlist
Add Position

Position added successfully to:

Please name your holdings portfolio
 
XLK
+0.10%
Add to/Remove from Watchlist
Add to Watchlist
Add Position

Position added successfully to:

Please name your holdings portfolio
 
  • Utilities notched a new high last week as the broad market retreated
  • Offers impressive relative strength and low volatility but long-term investors should take caution
  • Sector trades at rich valuation and relatively low dividend yield

The boring old Utilities sector has been on fire recently. It trades at a very rich price-to-earnings ratio. These trends have been ongoing for much of 2022 in the face of higher interest rates and a volatile stock market. According to Yardeni Research, the Utilities sector sports a forward P/E of 20.7—which is just slightly cheaper than the high-growth Technology sector as of August 17, for perspective.

S&P 500 Forward P/E Ratios: Utilities at A Premium to the S&P 500

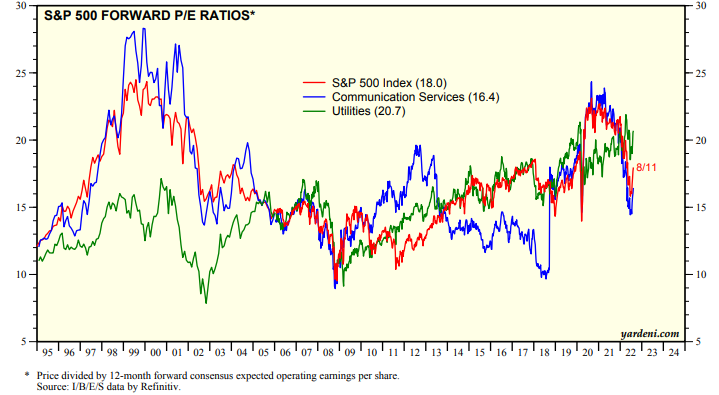
Source: Yardeni Research

Moreover, the niche’s expected earnings growth rate is not high (as you would imagine, given Utilities’ stable operating characteristics). Resulting PEG ratios, a useful valuation measure that compares an earnings multiple to the forecast earnings growth rate, across the sector are at nosebleed levels.

S&P 500 PEG Ratio Heat Map: Utilities’ Nosebleed Valuations

Source: Finviz

In the face of a pricey valuation, the Utilities ETF went out at a fresh all-time high last week. Making the move even more impressive was that the broad market suffered a more than 1% decline during the options expiration week, so relative strength was high on XLU. Thus far in 2022, the S&P 500 SPDR ETF Trust (NYSE:SPY) has returned a negative 10.5% while XLU is up a somewhat stunning 10.2% including dividends. Even since the June 16 low in stocks, Utilities are beating SPY by more than 300 basis points.

Utilities Sector ETF: Fresh All-Time Highs

Utilities Sector ETF

Source: Investing.com

Perhaps investors took a shine to just how well these companies, which make up just 3% of the S&P 500 index, according to iShares, performed during the second quarter. FactSet reports that the Utilities sector featured the second-largest positive aggregate earnings surprise (the difference between actual and estimated profits). NRG Energy (NYSE:NRG), Entergy (NYSE:ETR), and Southern Company (NYSE:SO) had the biggest EPS surprises. Moreover, the steady eddy sector had the biggest positive revenue surprise among all 11 areas of the market.

S&P Q2 Earnings Surprises: Energy, Utilities, Health Care Top the List
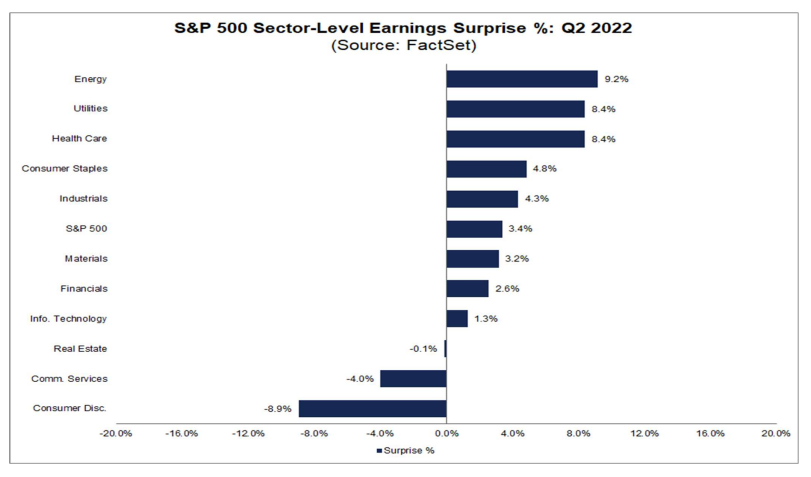
Source: FactSet

Another stealthy reason Utilities have outperformed lately could be the new 1% tax on stock buybacks. Power generation and transmission & distribution companies generally don’t repurchase many shares. According to J.P. Morgan Asset Management, the Utilities sector has a net negative buyback yield. All other sectors, excluding Real Estate, have a positive repurchase yield. More commonly known among investors is Utilities’ high dividend yield, which stood at 3.0% as of July 31.

Returns and Valuations by Sector

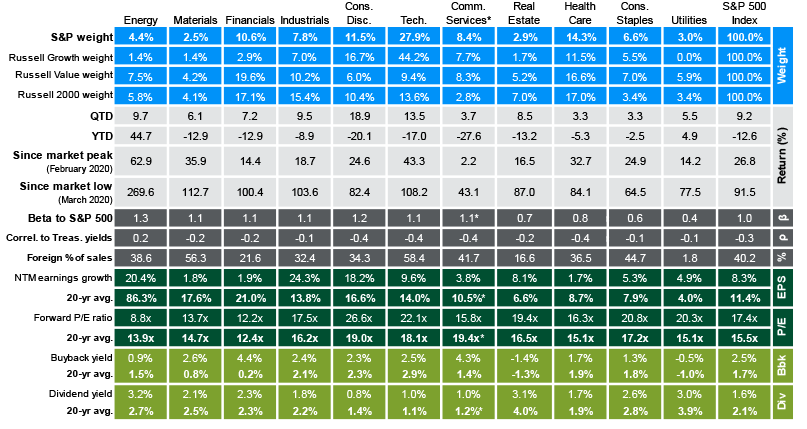
Source: J.P. Morgan Asset Management

I take a cautious stance on Utilities going forward. As a technical analyst, I completely respect its strong absolute and relative performances over the last few weeks (and all this year). Could there be more upside? Yes. In fact, there probably will be given that it’s the only sector making all-time highs. Longer term, though, sluggish growth could hinder returns. With a forward P/E ratio above 20 and a dividend yield that is about 25% below its 25-year average, Utilities appear expensive to me.

The Bottom Line

There are some positive characteristics of the Utilities sector right now. XLU has price momentum and a handful of industries that might benefit from new legislation aimed at beefing up the power grid. But a high valuation and historically low dividend yield make me cautious long term. While the sector feels safe amid a volatile market, don’t hide out long in this space.

Disclaimer: Mike Zaccardi does not hold any positions in the securities mentioned in this article.

Is Utilities Sector A Buy As It Climbs To All-Time Highs?
 

Related Articles

Is Utilities Sector A Buy As It Climbs To All-Time Highs?

Add a Comment

Comment Guidelines

We encourage you to use comments to engage with other users, share your perspective and ask questions of authors and each other. However, in order to maintain the high level of discourse we’ve all come to value and expect, please keep the following criteria in mind:  

  •            Enrich the conversation, don’t trash it.

  •           Stay focused and on track. Only post material that’s relevant to the topic being discussed. 

  •           Be respectful. Even negative opinions can be framed positively and diplomatically. Avoid profanity, slander or personal attacks directed at an author or another user. Racism, sexism and other forms of discrimination will not be tolerated.

  • Use standard writing style. Include punctuation and upper and lower cases. Comments that are written in all caps and contain excessive use of symbols will be removed.
  • NOTE: Spam and/or promotional messages and comments containing links will be removed. Phone numbers, email addresses, links to personal or business websites, Skype/Telegram/WhatsApp etc. addresses (including links to groups) will also be removed; self-promotional material or business-related solicitations or PR (ie, contact me for signals/advice etc.), and/or any other comment that contains personal contact specifcs or advertising will be removed as well. In addition, any of the above-mentioned violations may result in suspension of your account.
  • Doxxing. We do not allow any sharing of private or personal contact or other information about any individual or organization. This will result in immediate suspension of the commentor and his or her account.
  • Don’t monopolize the conversation. We appreciate passion and conviction, but we also strongly believe in giving everyone a chance to air their point of view. Therefore, in addition to civil interaction, we expect commenters to offer their opinions succinctly and thoughtfully, but not so repeatedly that others are annoyed or offended. If we receive complaints about individuals who take over a thread or forum, we reserve the right to ban them from the site, without recourse.
  • Only English comments will be allowed.
  • Any comment you publish, together with your investing.com profile, will be public on investing.com and may be indexed and available through third party search engines, such as Google.

Perpetrators of spam or abuse will be deleted from the site and prohibited from future registration at Investing.com’s discretion.

Write your thoughts here
 
Are you sure you want to delete this chart?
 
Post
Post also to:
 
Replace the attached chart with a new chart ?
1000
Your ability to comment is currently suspended due to negative user reports. Your status will be reviewed by our moderators.
Please wait a minute before you try to comment again.
Thanks for your comment. Please note that all comments are pending until approved by our moderators. It may therefore take some time before it appears on our website.
 
Are you sure you want to delete this chart?
 
Post
 
Replace the attached chart with a new chart ?
1000
Your ability to comment is currently suspended due to negative user reports. Your status will be reviewed by our moderators.
Please wait a minute before you try to comment again.
Add Chart to Comment
Confirm Block

Are you sure you want to block %USER_NAME%?

By doing so, you and %USER_NAME% will not be able to see any of each other's Investing.com's posts.

%USER_NAME% was successfully added to your Block List

Since you’ve just unblocked this person, you must wait 48 hours before renewing the block.

Report this comment

I feel that this comment is:

Comment flagged

Thank You!

Your report has been sent to our moderators for review
Continue with Google
or
Sign up with Email