Get 40% Off
🚨 Volatile Markets? Find Hidden Gems for Serious OutperformanceFind Stocks Now

Is USD/JPY Ready To Fall Below 109.05?

Published 08/03/2021, 07:07 AM
Updated 07/09/2023, 06:31 AM

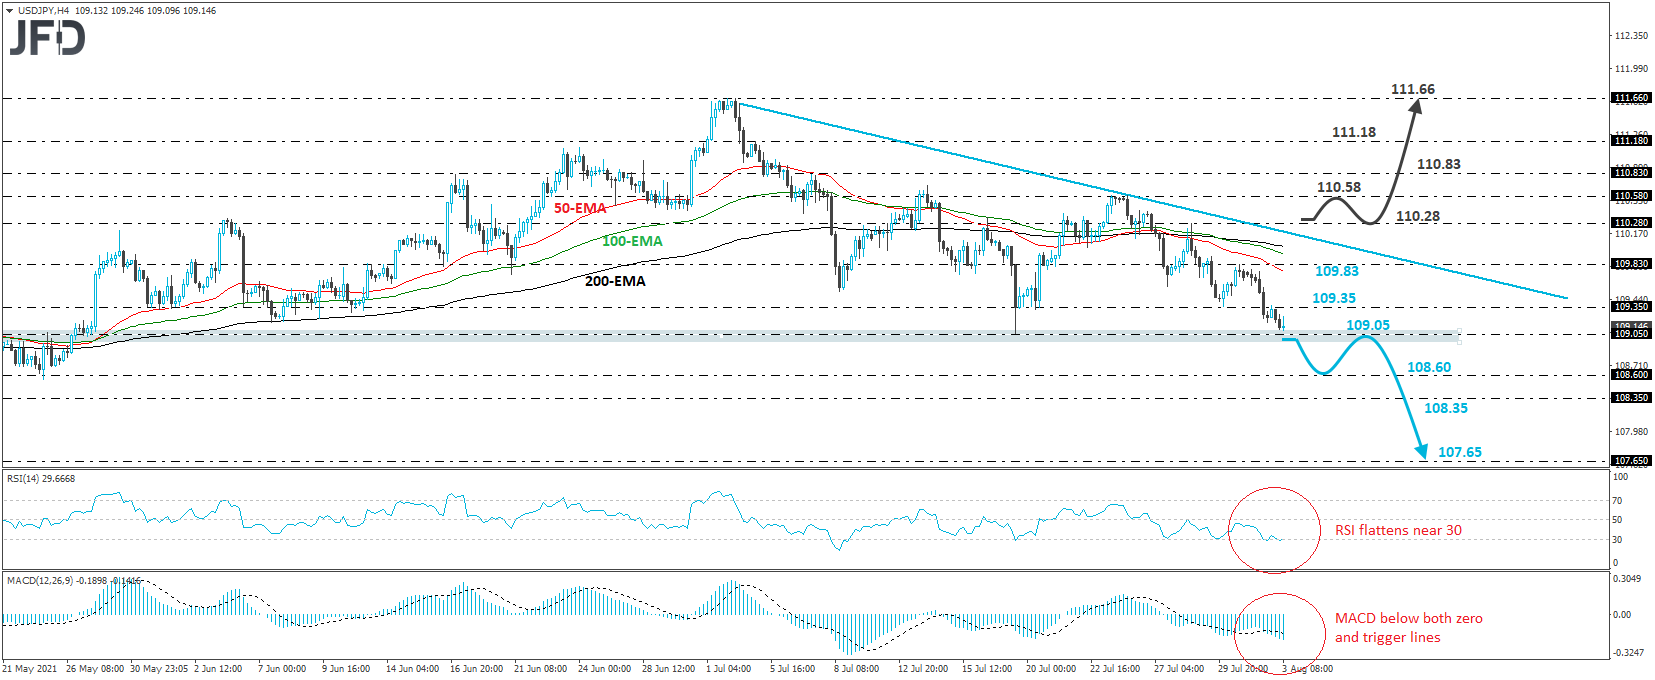
USD/JPY traded lower on Tuesday, after it hit resistance at 109.35 on Monday. Overall, the rate continues to trade below the downside resistance line drawn from the high of July 2, and thus, we would consider the short-term outlook to still be negative. However, in order to get confident on larger declines, we would like to see a break below the key support zone of 109.05.

A clear and decisive break below that territory, which acted as a support on July 19 and back on May 27, as well as a resistance between May 21 and 25, may encourage more bears to join in an perhaps take the action down to the 108.60 barrier, which provided support between May 19 and 25. If that barrier does not hold this time around, we could see the slide extending towards the 108.35 level, marked by the lows of May 7 and 11, the break of which could carry larger bearish implications, perhaps setting the stage for the low of Apr. 26, at around 107.65.

Looking at our short-term oscillators, we see that the RSI slid to its 30 line, but flattened there, while the MACD remains below both its zero and trigger lines. Both indicators detect downside speed, but the fact that the RSI has flattened near its 30 line makes us a bit careful. That’s an extra reason to wait for a dip below 109.05 before getting confident on larger declines.

On the upside, the picture could turn bullish upon a break above 110.28, the high of July 28. Such a move may also confirm the break above the aforementioned downside line and probably aim for the 110.58 barrier, near the highs of July 23 and 26, the break of which could allow advances towards the 110.83 area, marked by the high of July 7. If neither territory is able to stop the buyers, then they could climb to the 111.18 zone, where another break could extend the advance towards the 111.66 territory, defined as a resistance by the highs of July 1 and 2.
USD/JPY 4-hour chart technical analysis

3rd party Ad. Not an offer or recommendation by Investing.com. See disclosure here or remove ads .

Latest comments

Risk Disclosure: Trading in financial instruments and/or cryptocurrencies involves high risks including the risk of losing some, or all, of your investment amount, and may not be suitable for all investors. Prices of cryptocurrencies are extremely volatile and may be affected by external factors such as financial, regulatory or political events. Trading on margin increases the financial risks.
Before deciding to trade in financial instrument or cryptocurrencies you should be fully informed of the risks and costs associated with trading the financial markets, carefully consider your investment objectives, level of experience, and risk appetite, and seek professional advice where needed.
Fusion Media would like to remind you that the data contained in this website is not necessarily real-time nor accurate. The data and prices on the website are not necessarily provided by any market or exchange, but may be provided by market makers, and so prices may not be accurate and may differ from the actual price at any given market, meaning prices are indicative and not appropriate for trading purposes. Fusion Media and any provider of the data contained in this website will not accept liability for any loss or damage as a result of your trading, or your reliance on the information contained within this website.
It is prohibited to use, store, reproduce, display, modify, transmit or distribute the data contained in this website without the explicit prior written permission of Fusion Media and/or the data provider. All intellectual property rights are reserved by the providers and/or the exchange providing the data contained in this website.
Fusion Media may be compensated by the advertisers that appear on the website, based on your interaction with the advertisements or advertisers.
© 2007-2024 - Fusion Media Limited. All Rights Reserved.