
As we end this week we also come to the middle of the month of March. So far this month, we have seen two large weekly candles form on the chart. The first week of March, which was last week, we saw what looked like might be the beginning of a new down trend. This week we saw a complete, or near complete, reversal of last week’s bearish down candle. This move up could be another bullish cycle in the current bullish trend. If it is, we are likely to see some new highs come into the markets over the next couple of weeks.
The markets continue to show concerns about the global economy being able to continue to grow at an acceptable rate moving forward. This is one of the reasons we may be seeing an increase in the volatility of the markets. One of the big news items we have been watching is the concerns surrounding the Brexit vote. This is likely to continue to be an issue moving forward. This upcoming week, in addition to more Brexit voting, we are going to have the FOMC statement release as well as the FOMC Press conference on Wednesday.
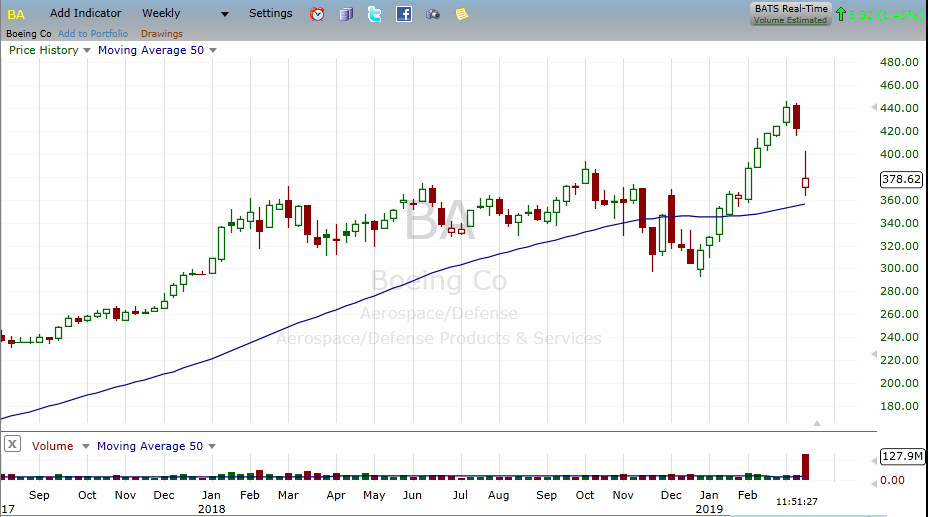
One of the big stock movements happened with the crash of one of the Boeing (NYSE:BA) newest planes. This tragic event caused the stock to drop significantly. This is an example of an unexpected risk that we see in the markets as they are not scheduled or planned. This is also why we need to make sure we are alway using good risk management in our trades.
Let’s take a look at how the markets performed this last week.
DJ-30:
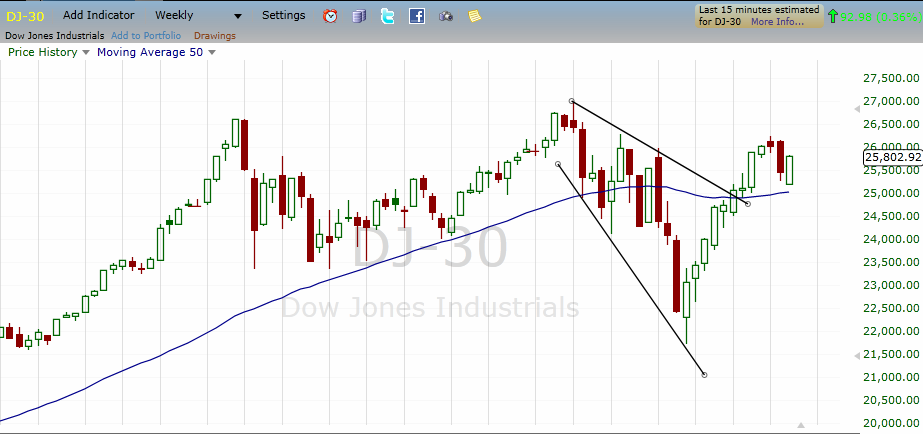
Prices in the DJ-30 moved lower early in the week but ended up strong as the price action was able to bounce up and off of the support area of the 50 period simple moving average. This moving average continues to move up and is likely to add strength to the price movement.
SP-500:
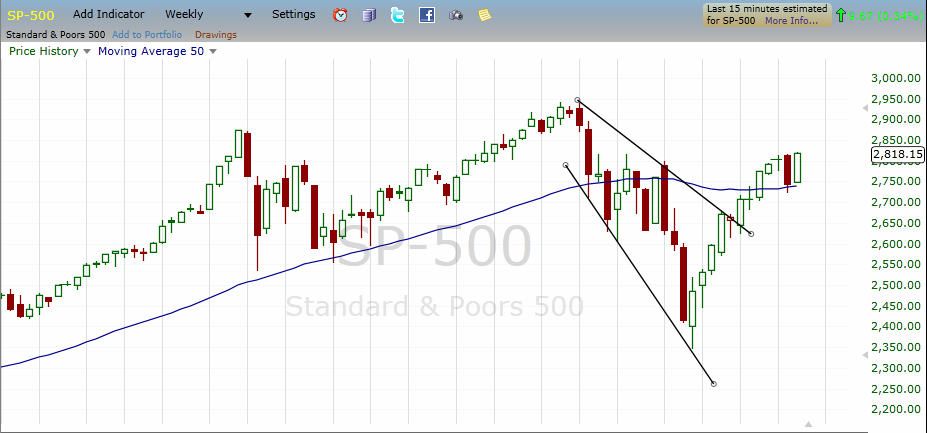
The weekly chart of the SP-500 shows prices moving back up again as it is also moving up from the 50 period simple moving average. This could be the beginning of another move up and testing of the prior highs. We will see if the bulls can continue to add strength and push prices up again this upcoming week.
NASDAQ:
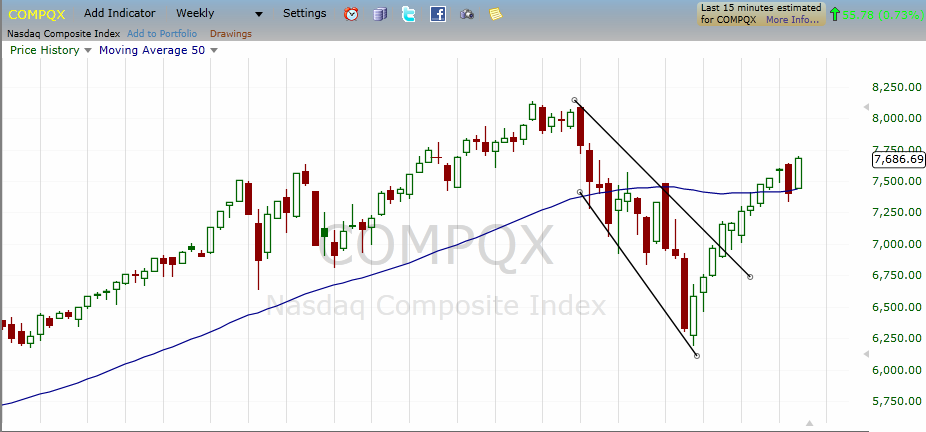
The weekly chart of the NASDAQ broke below the 50 period simple moving average last week but bounced hard from it to move higher this week. This chart is the strongest of the 3 and seems to be leading prices higher. Just like the others, we are going to monitor to see if a new price surge happens and we test out some new highs in the next couple of weeks.
While we saw a strong move up this week, we do have several big news announcements that could cause a reversal of this. Make sure you are using good risk management and know when you are going to exit out of your trades.