The stock market continues its almost relentless rally, with only 1 weekly pullback in the past 12 weeks. Meanwhile, many traders who spot various “divergences” in the markets are asking “what is the stock market smoking?”

Let’s determine the stock market’s most probable medium-term direction by objectively quantifying technical analysis. For reference, here’s the random probability of the U.S. stock market going up on any given day.

*Probability ≠ certainty. Past performance ≠ future performance. But if you don’t use the past as a guide, you are blindly “guessing” the future.
Cyclical vs. Defensive
Cyclical stocks have failed to outperform defensive stocks during most of the current stock market rally. “The last time this happened” was before the October 2018 stock market high. To calculate the cyclical: defensive ratio we can use the XLY: XLP ratio.

Is the divergence between the XLY: XLP ratio and the S&P 500 a bearish sign for stocks?
Here’s what happens next to the S&P 500 when the XLY: XLP ratio falls over the past 45 days while the S&P rises more than 8%.
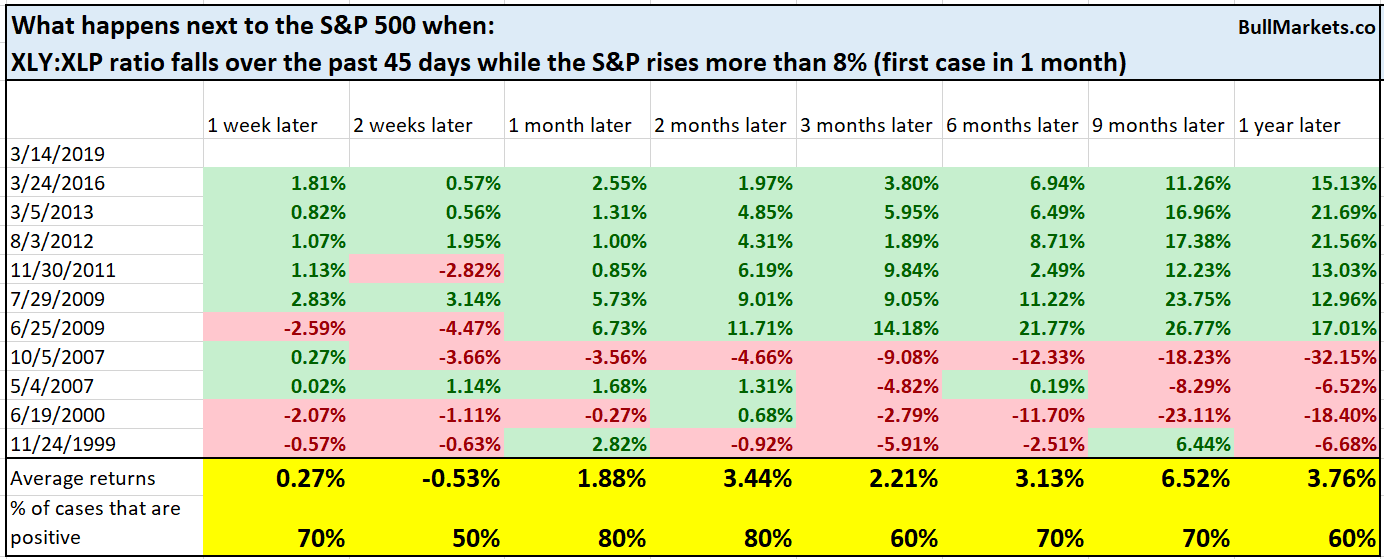
While this did happen before the 2000 and 2007 bull market tops, it also did happen in a lot of other bull market cases. So not quite consistently bearish for stocks (but is something to watch out for).
This is the problem with fixating on charts and “the last time XYZ happened”. Our brains are hardwired to remember only the cases that suit our pre-existing bias. Only by looking at the data holistically can we push away from our biases.
Are stocks on drugs?
Charlie Bilello from Pension Partners recently conducted a very insightful poll about the average trader.
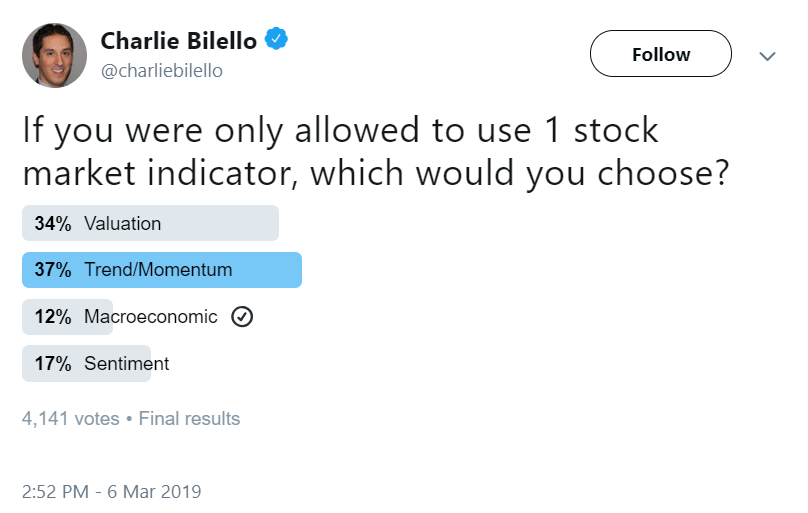
As you can see, the average trader prefers technical analysis, valuations, and sentiment. These are things that anyone can learn rather quickly. The average trader prefers macroeconomic indicators the least because these are often confusing and hard to understand (it’s difficult to separate the macroeconomic signal from the noise).
Personally, here’s how I would order these indicators from most important to least important.
- Macroeconomic (by far)
- Technical indicators
- Valuations. (These are more useful on a 5-10 year basis. It doesn’t tell you where markets will go this year or next year).
- Sentiment
- Chart patterns
With that being said, a great way to look at trader sentiment is to type in “$SPX” into the Twitter search bar. Twitter tends to rank tweets based on their popularity, so the most popular trains of thought will rise to the top.
A very popular train of thought right now is “is the stock market high? How can it keep rallying when so many indicators and other markets are ‘diverging’ from the stock market”?
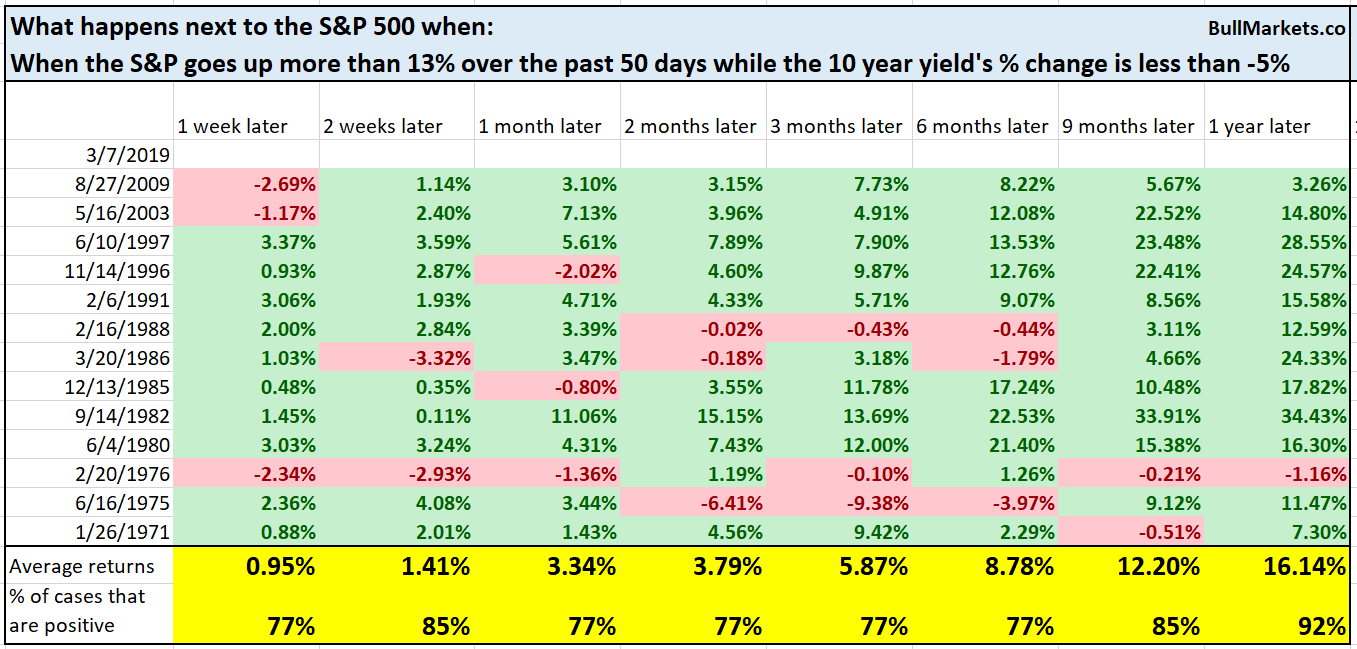
For example, the S&P has diverged from the 10 year Treasury yield. We mentioned this a few days ago and demonstrated that this is perfectly normal. There is nothing bearish about the S&P diverging from interest rates because this happens all the time.
The 10 year – 3 month yield curve made a new low today. With the S&P 500 making new highs, some traders are wondering “how can this happen? Surely the S&P can’t decouple from the yield curve for long”.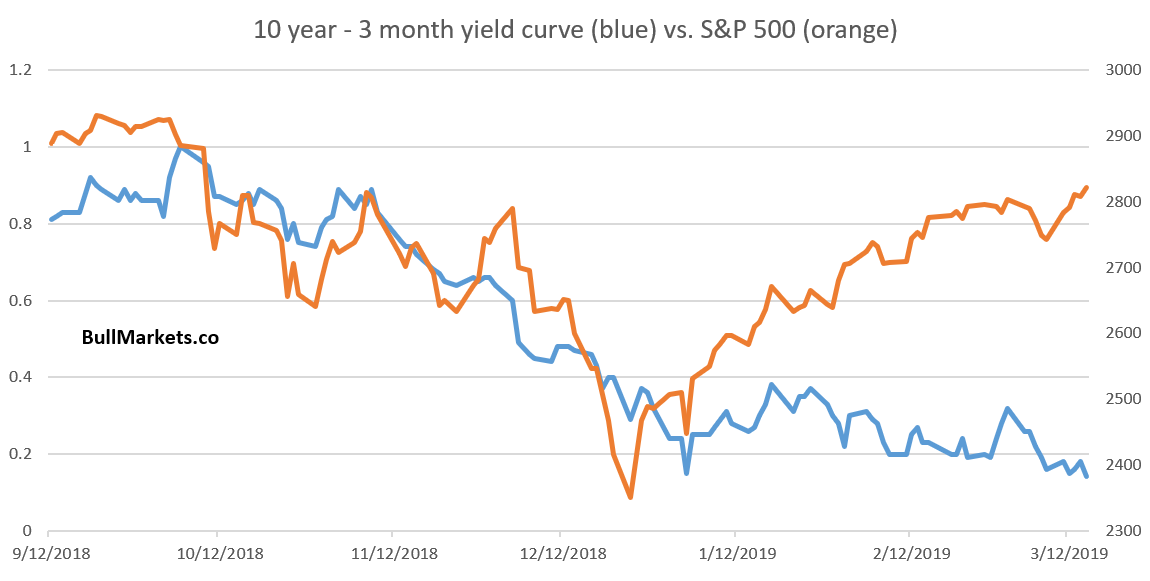
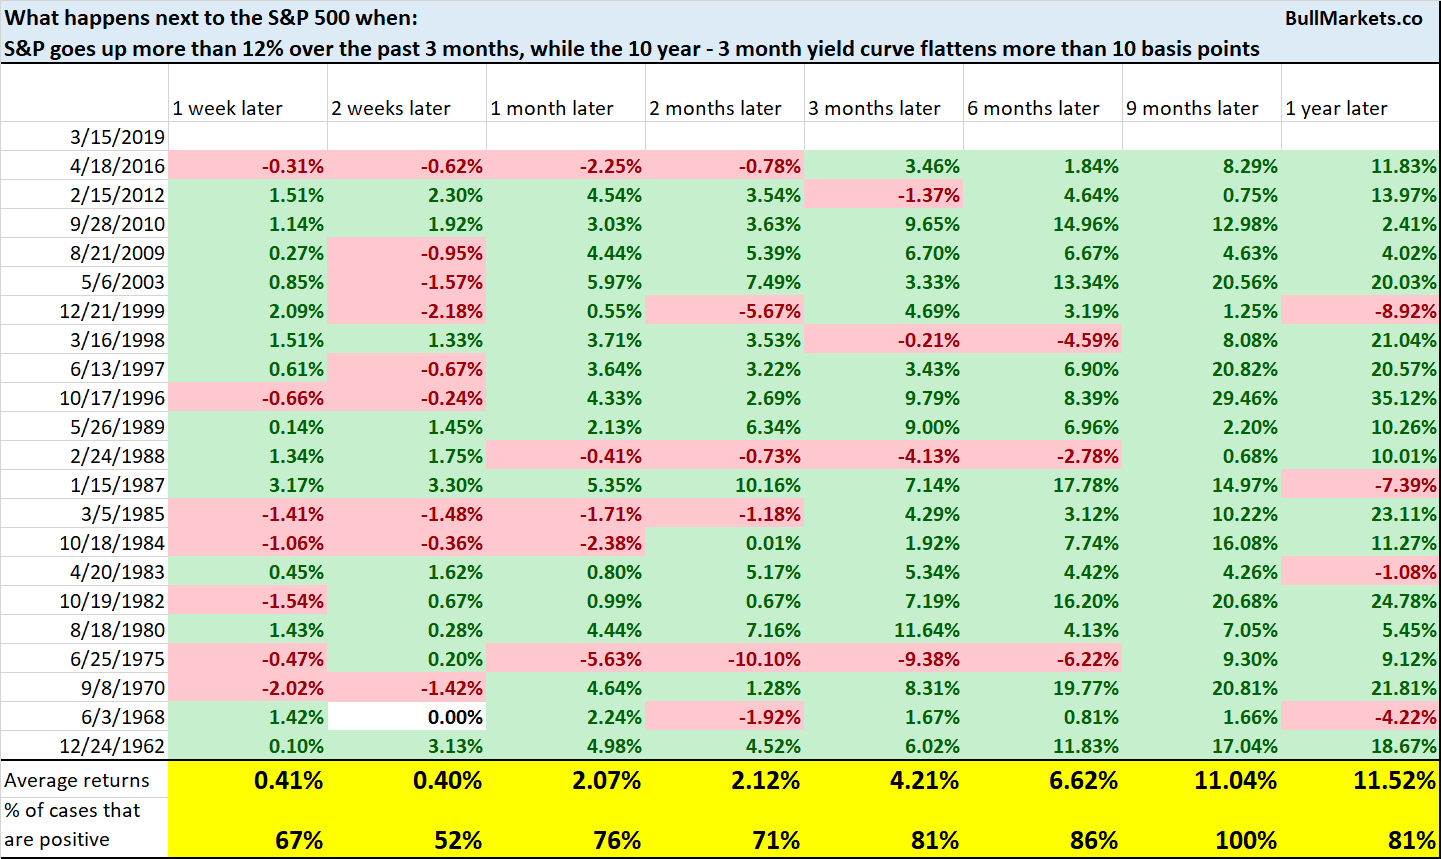
Actually, such “decoupling” happens all the time and is perfectly normal. This is not consistently bearish for stocks, especially 6-12 months later.
#factchecking. There are some valid reasons to be bearish, but these “divergences” aren’t among those valid reasons. Correlations break all the time.
Nordea
One of the real reasons to be worried (long term speaking) is the potential for the U.S. economy to deteriorate significantly later this year. Macroeconomic data is holding up ok right now, but could become worse later this year.
Nordea has an interesting chart demonstrating that based on their model, GDP growth is set to fall significantly soon.
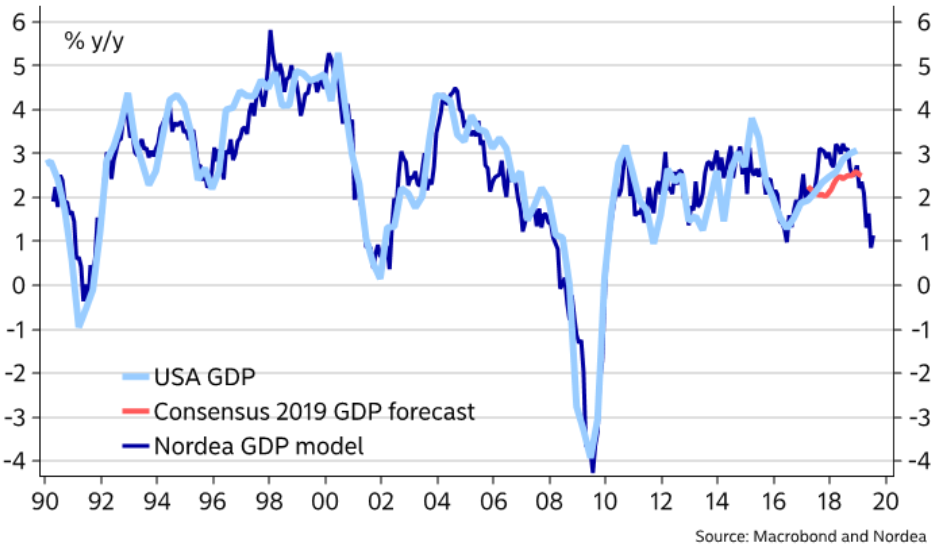
Here’s a longer chart for real GDP growth.
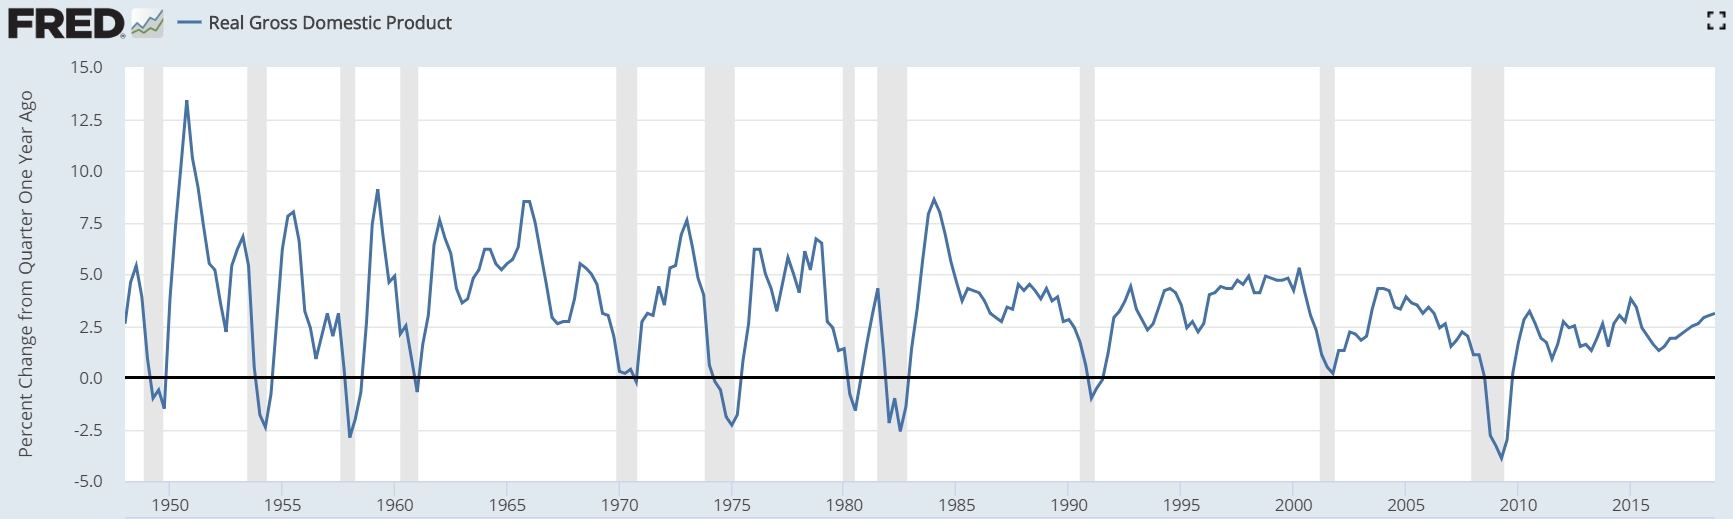
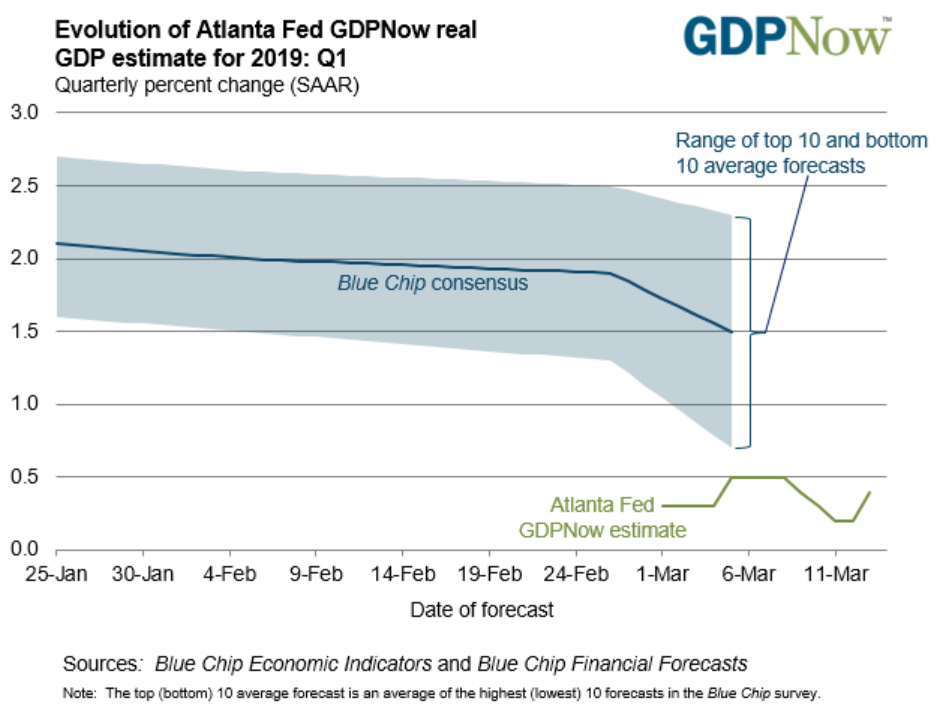
Likewise, the Atlanta Fed’s GDPNow also estimates that Q1 GDP will be worse than expected.
Let’s assume that Nordea is right. Here’s what happens next to the S&P when year-over-year real GDP growth falls to 1%
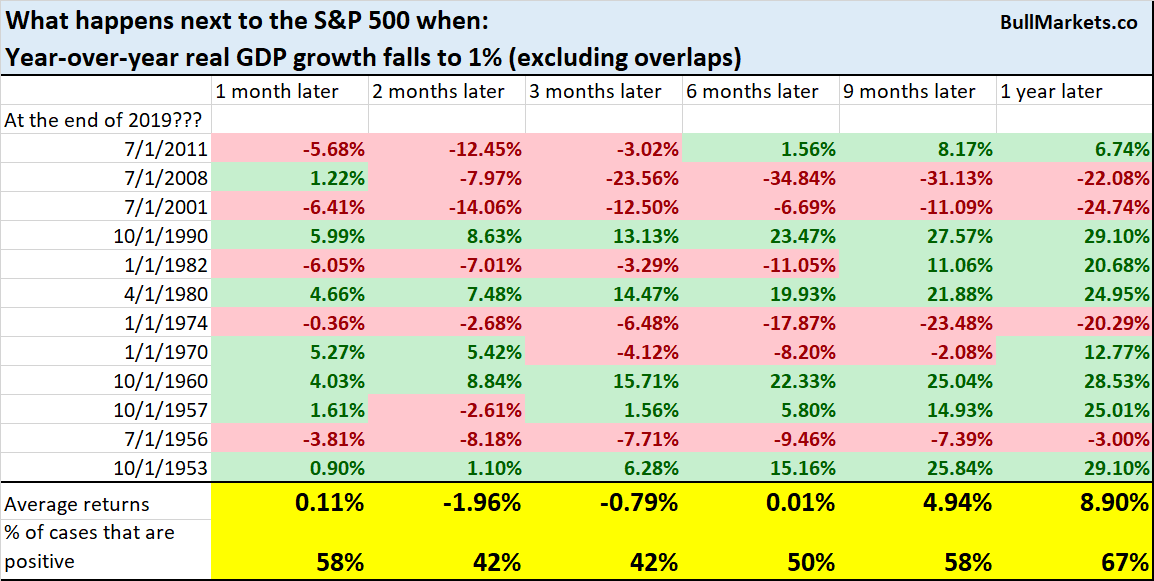
Looking at the historical dates, this happened exclusively near economic recessions. Not a good sign for the U.S. stock market and economy.
*This hasn’t happened yet, but watch out if it does happen later in 2019.
XLU
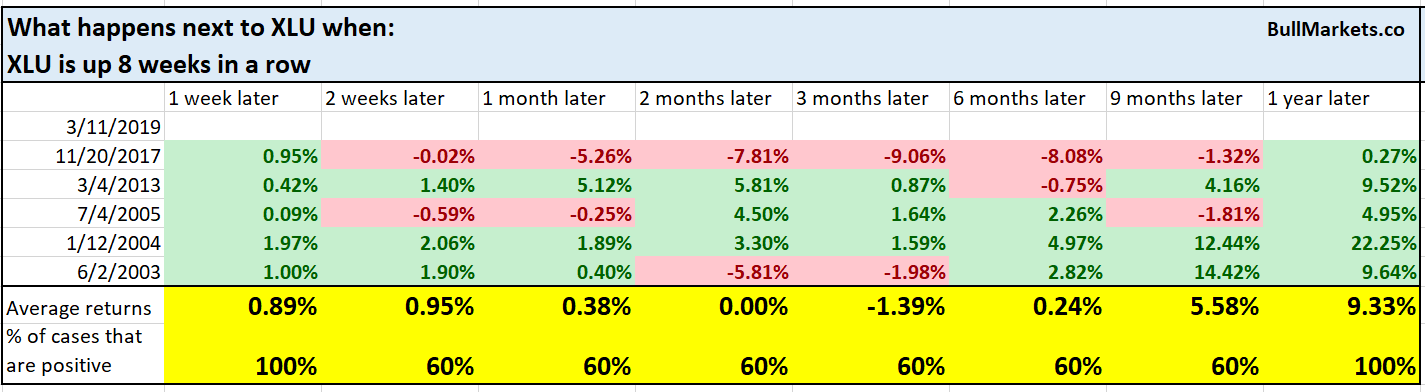
XLU (utilities sector ETF – defensive sector) is on fire. XLU is up 8 weeks in a row.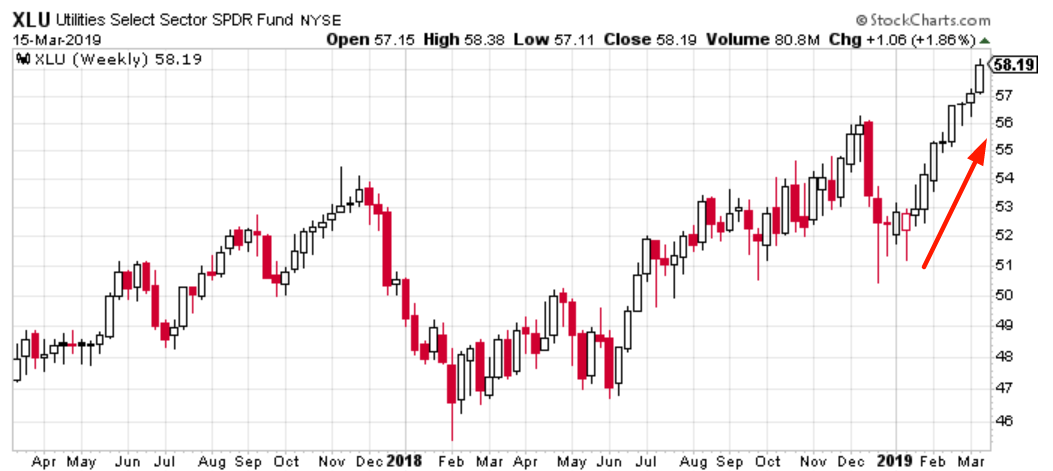
Here’s what happens next to the S&P when XLU is up 8 weeks in a row.
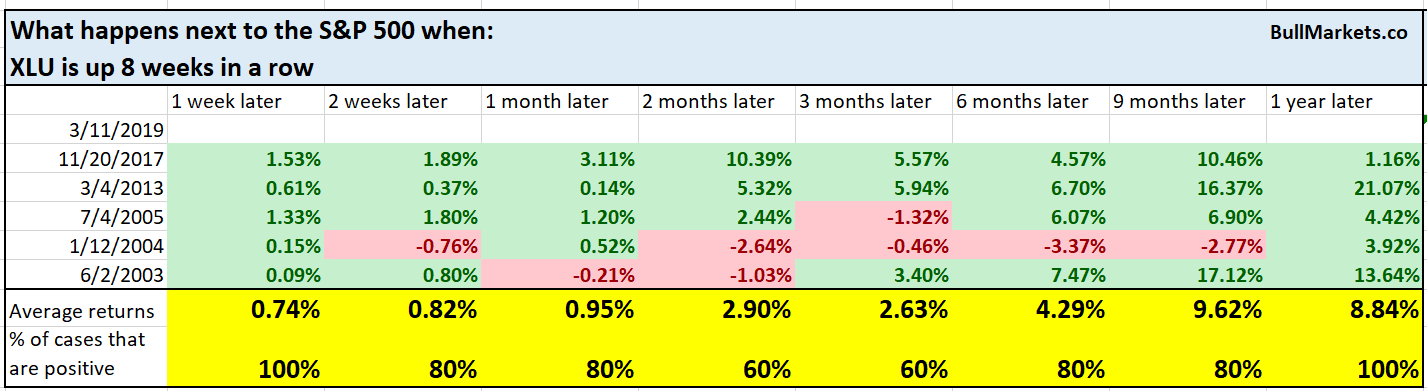
Here’s what happens next to XLU
*Remember: price action and technical analysis are less useful than fundamentals. Fundamental relationships change more infrequently while technical relationships change more frequently.
NASDAQ on fire
Like XLU, the NASDAQ is also on fire. The NASDAQ has now gone up 11 of the past 12 weeks.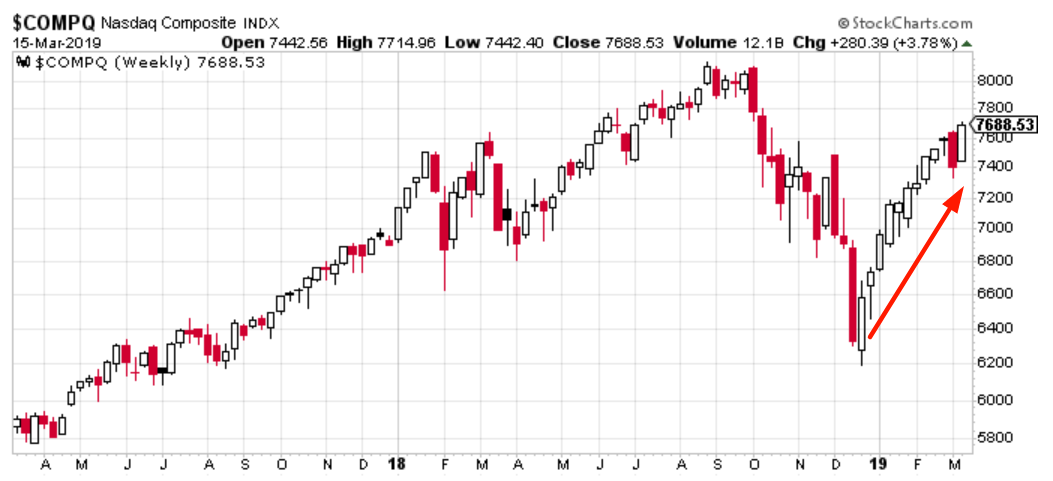
Here’s what happens next to the S&P when the NASDAQ goes up at least 11 of the past 12 weeks.
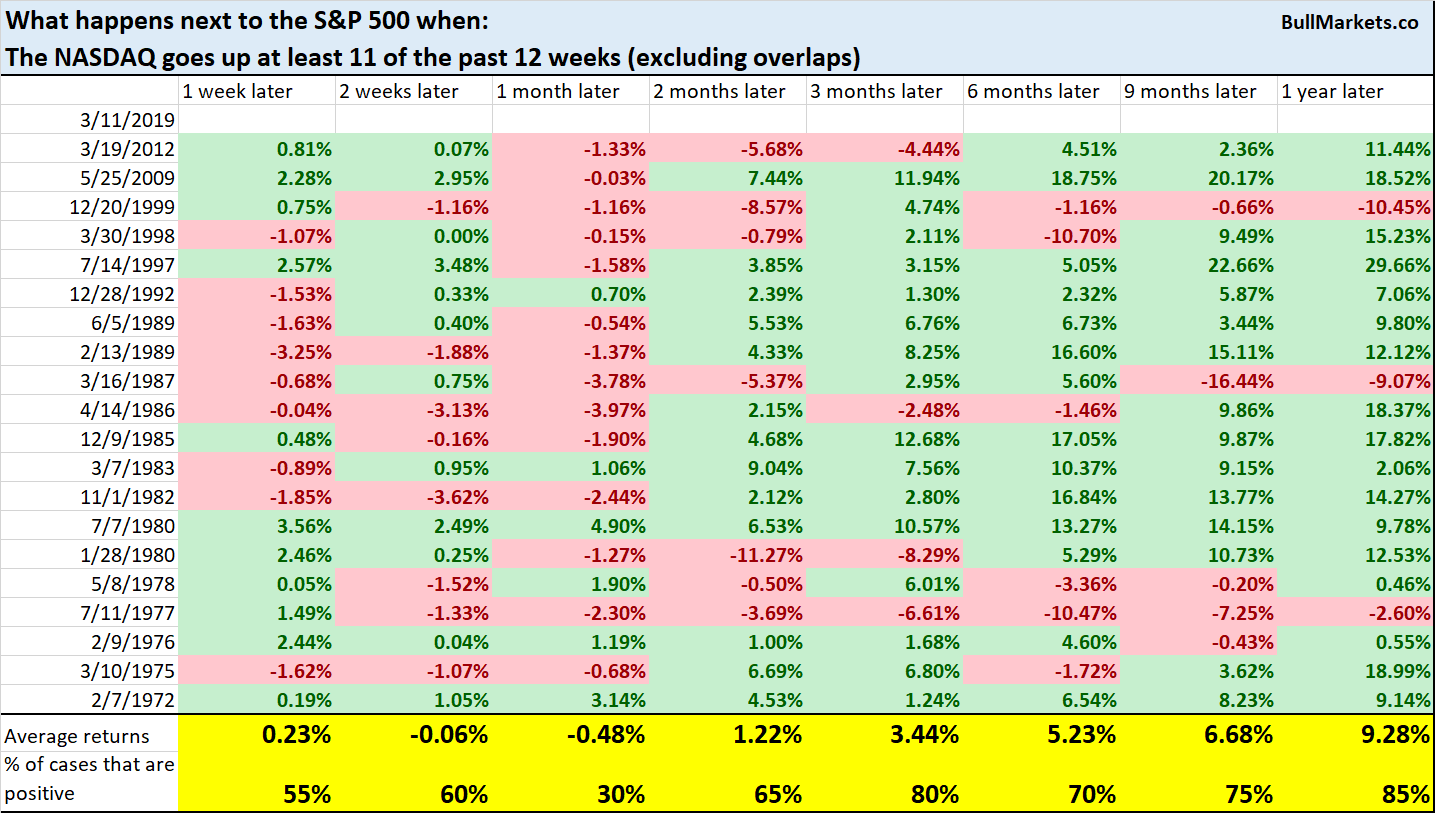
Somewhat bearish over the next month. But remember: the short term is always extremely hard to predict, no matter what edge you think you have.
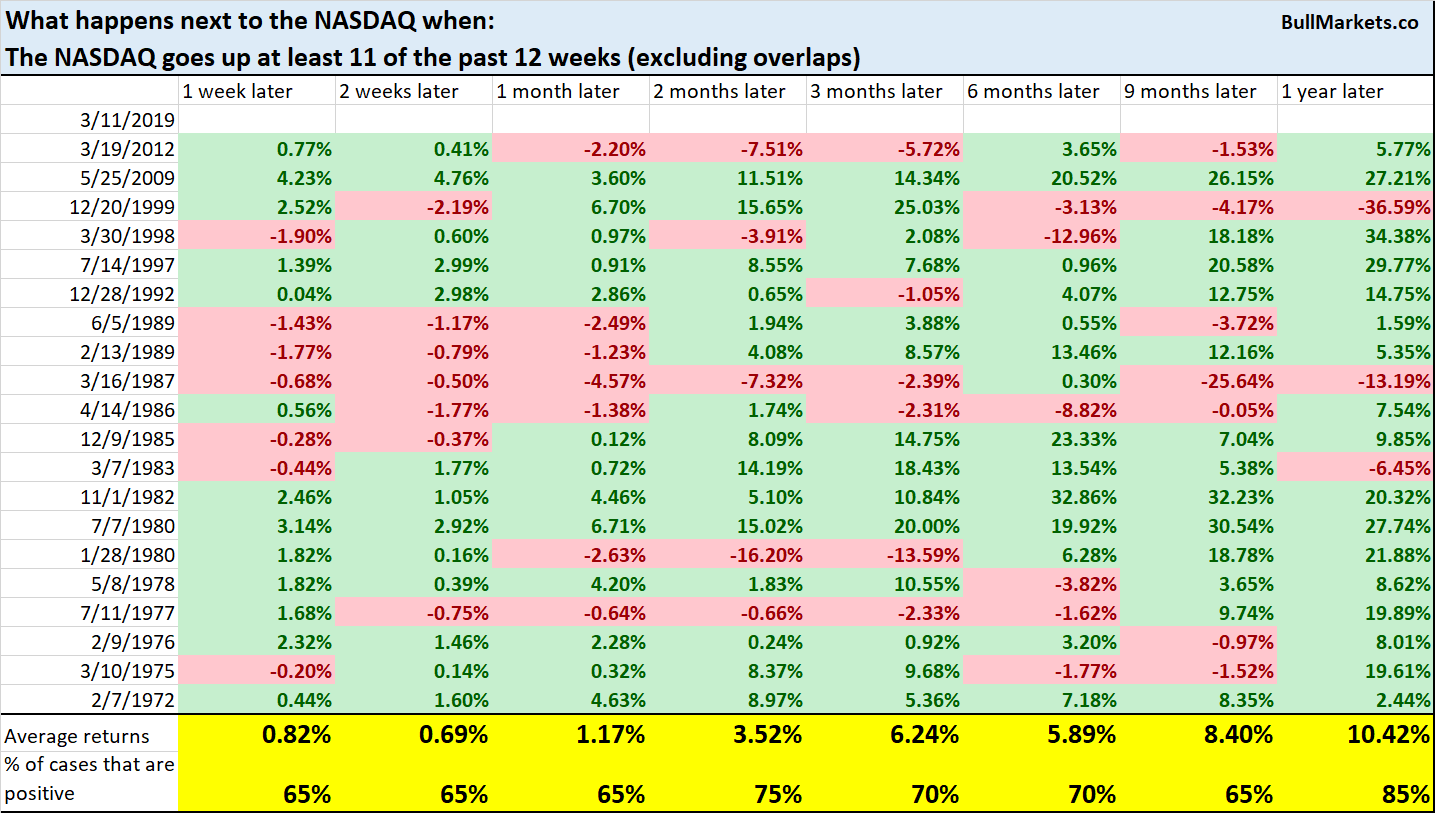
Here’s what happens next to the NASDAQ:
VIX crushed (again)
VIX continues to make new lows for this year. VIX is now below 13.
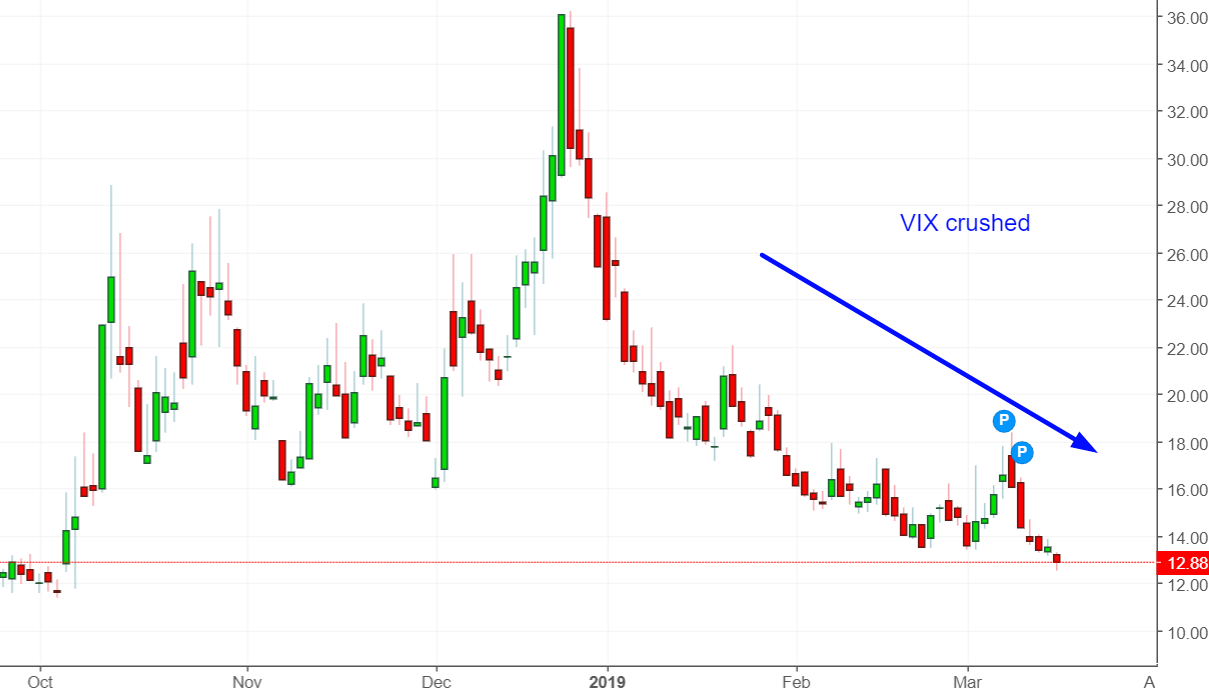
Here’s what happens next to the S&P when VIX closes below 13.
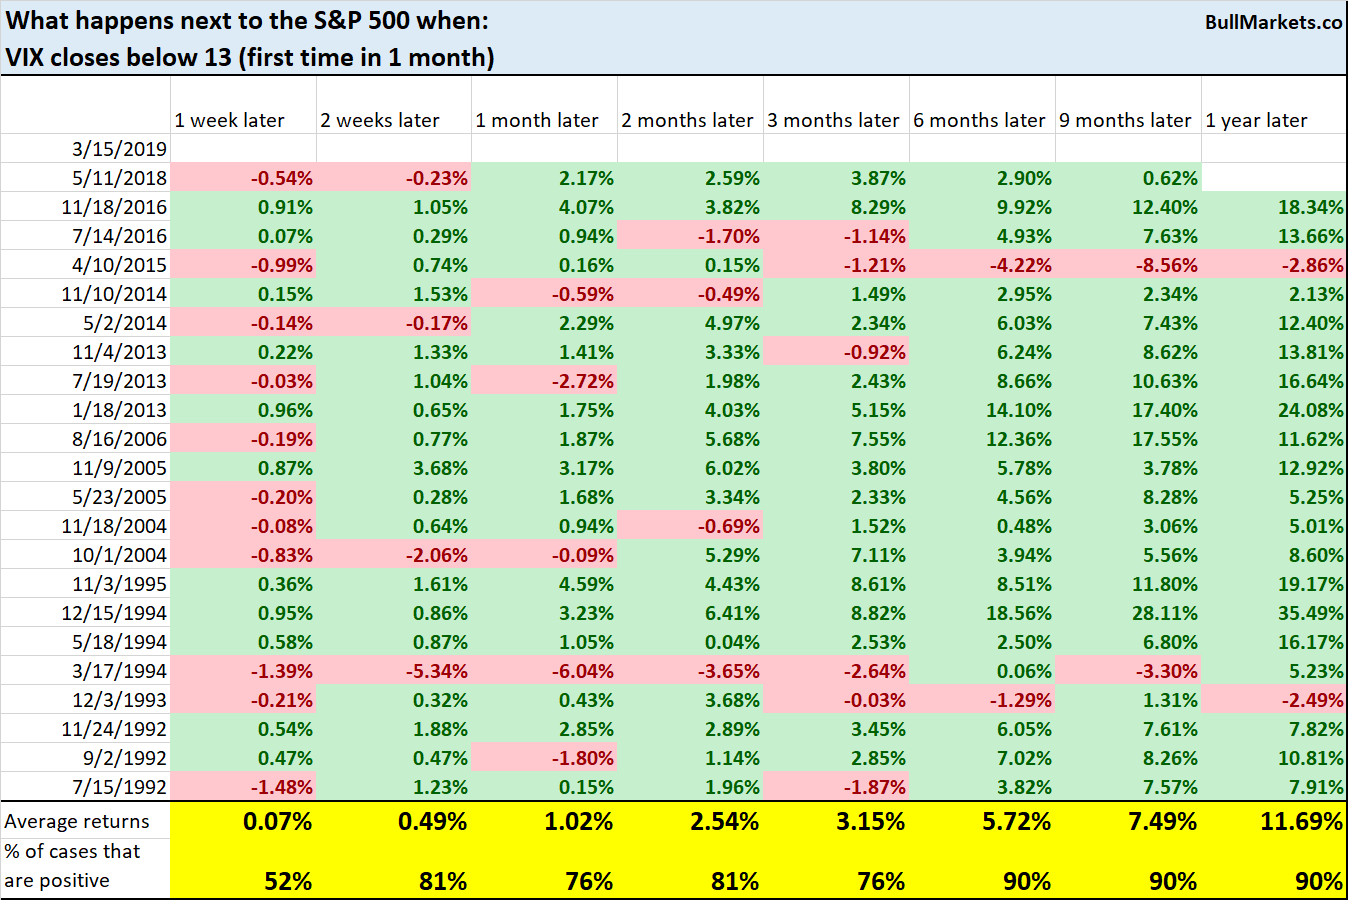
The 2000 and 2007 bull market tops started when VIX was much higher.
Active Fund Managers
Interesting article from CNBC: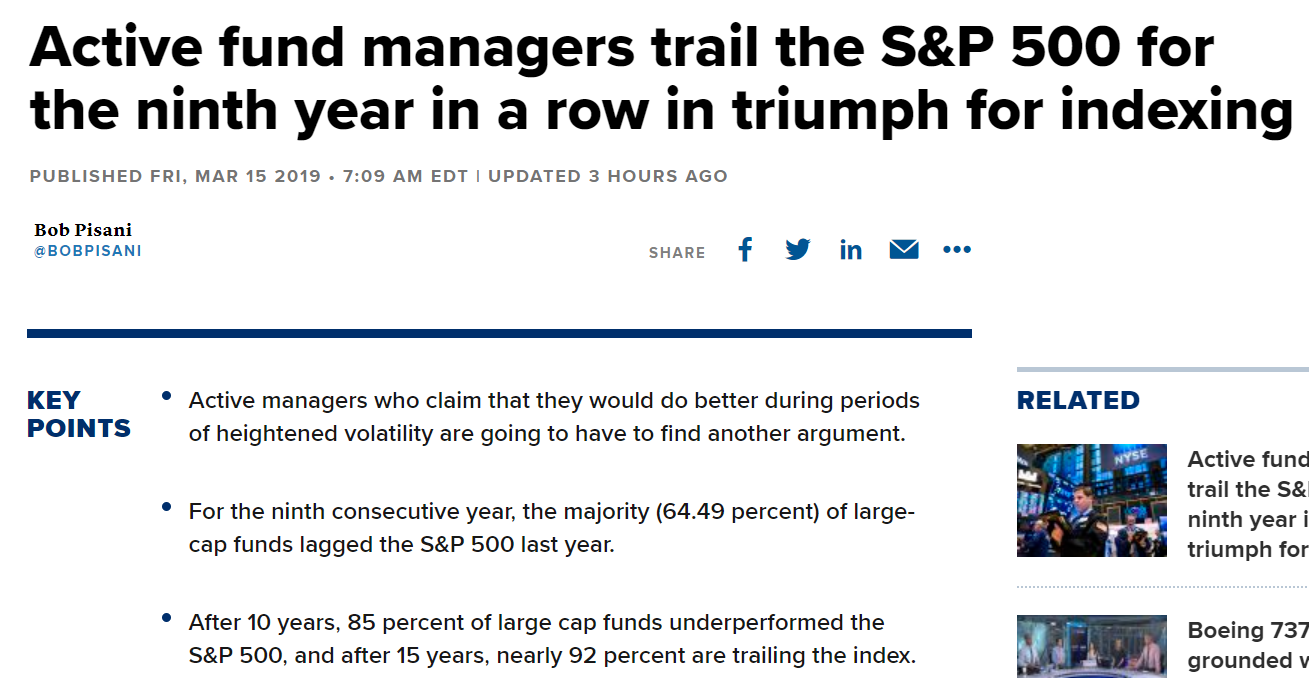
It’s hard to beat buy and hold when you charge 2-and-20. Think about that the next time a hedge fund manager voices his market opinion on financial TV.
Conclusion
Here is our discretionary market outlook:
- The U.S. stock market’s long term risk: reward is no longer bullish. In a most optimistic scenario, the bull market probably has 1 year left. Long term risk: reward is more important than trying to predict exact tops and bottoms.
- The medium-term direction (e.g. next 6-9 months) is more bullish than bearish.
- The stock market’s short term has a bearish lean due to the large probability of a pullback/retest. Focus on the medium-long term (and especially the long term) because the short term is extremely hard to predict.
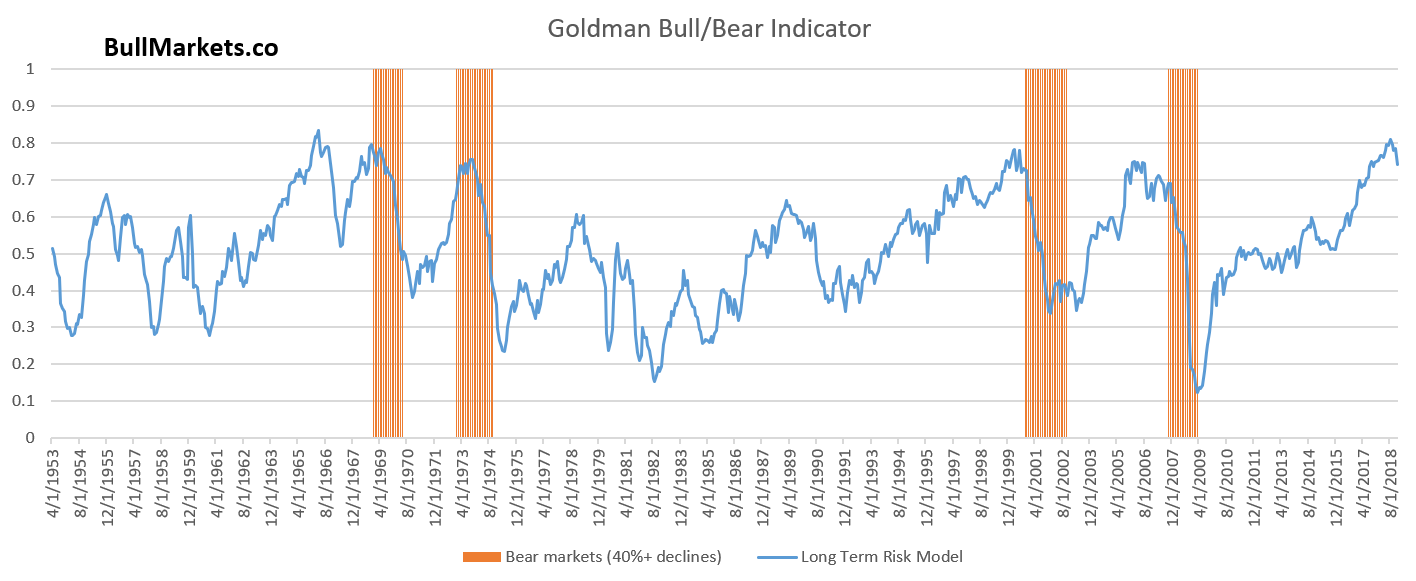
Goldman Sachs’ Bull/Bear Indicator demonstrates that while the bull market’s top isn’t necessarily in, risk: reward does favor long term bears.