Get 40% Off
👀 👁 🧿 All eyes on Biogen, up +4,56% after posting earnings. Our AI picked it in March 2024.
Which stocks will surge next?
Unlock AI-picked Stocks

Is The S&P 500 Forming And Ending Diagonal Triangle 5th Wave?

Published 06/27/2017, 01:07 AM
Updated 07/09/2023, 06:31 AM

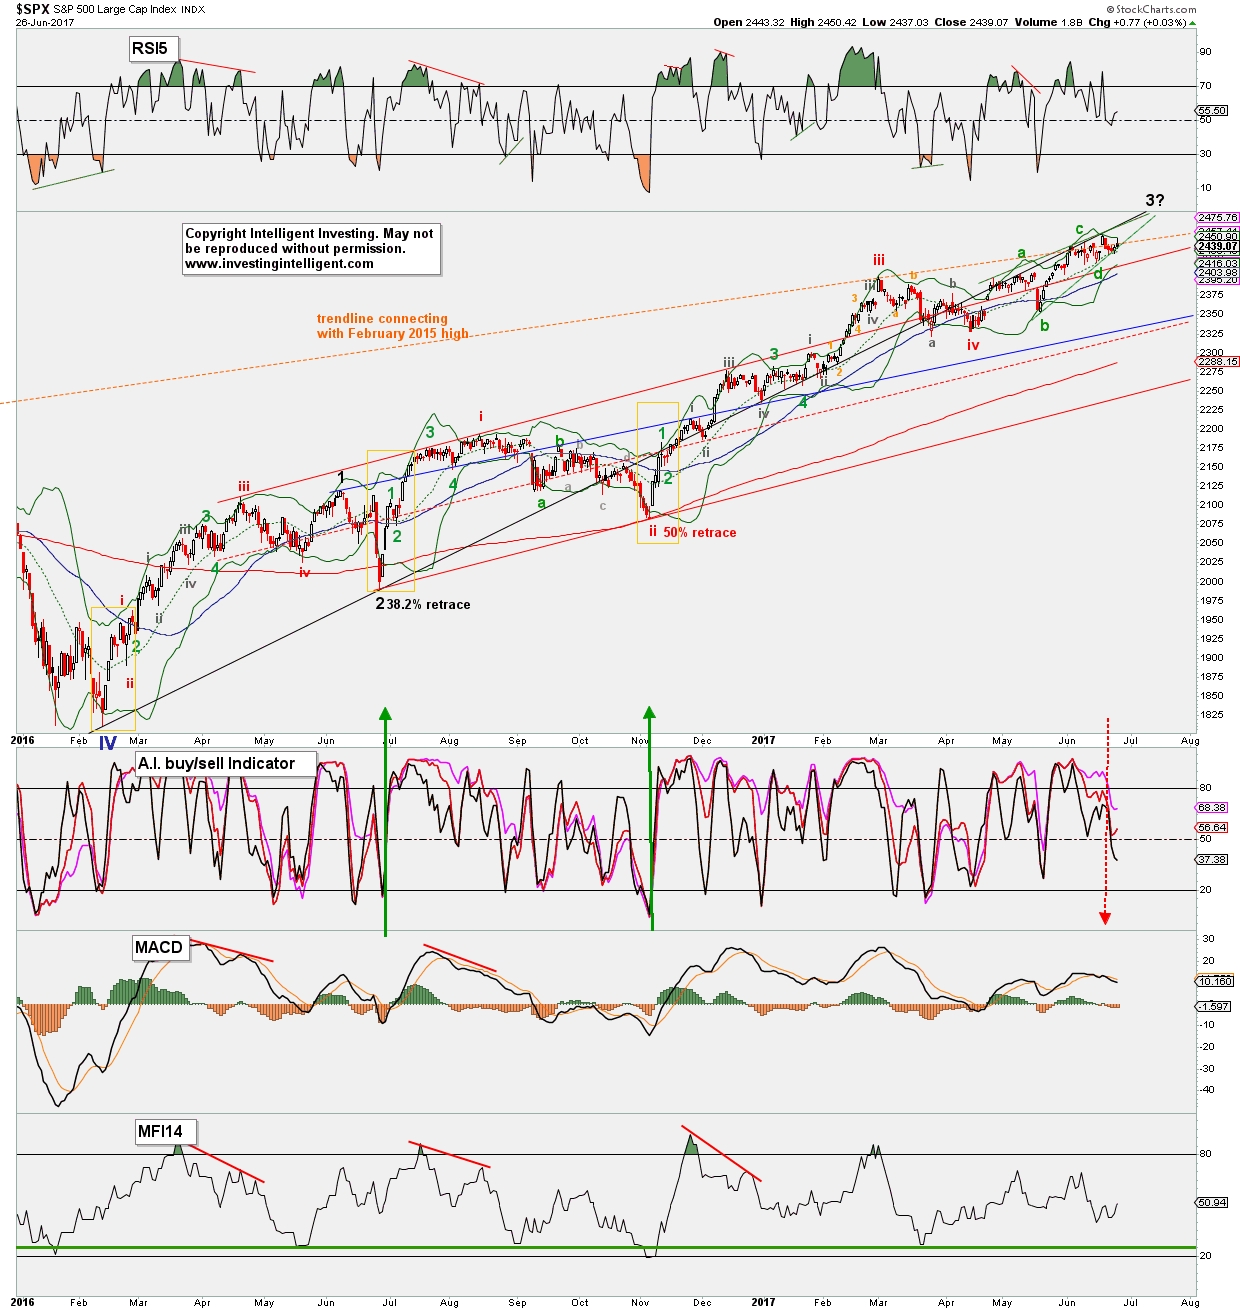
Recently the S&P 500 has been stuck in 3rd gear: in between the NASDAQ which lost its footing June 9, and the DOW which has steadily marched higher. This “stop-n-go” type behaviour (breakout attempts being sold and shallow dips being bought) can be indicative of an Ending Diagonal Triangle (EDT) 5th wave, which are notorious for breaking down swiftly once completed. It’s best counted as a set of a,b,c,d,e waves that best resemble a 3,3,3,3,3 structure. The daily chart of the S&P 500 below shows this count off the SPX 2329 low made on April 13 (seems like ages ago doesn’t it!?). Although we can count it also still as a standard 1,2,3,4,5 impulse the triangle formation is rathe clear and the price action in June leaves a lot to be desired.

S&P500 daily chart with TIs and Elliot Wave count

Since we don’t want to front run the market, but let it guide us (in our trades), we are waiting for confirmation of a top by a break below SPX2416, until then the EDT and standard Impulse count prevail and point higher towards the ideal target zone of SPX2475-2500, we’ve had for quite some time. However, clearly now is not the time to be complacent and bet large on continued upside, especially since EDTs are retraced often fully to their origin: in this case low 2300s on the S&P 500. That’s max 60p upside potential vs 140p downside risk. Not the risk reward longer term traders would like to see. Of course buy, selling and/or holding is everybody’s personal choice, but I prefer to buy low and sell high and exit the market when things become increasingly unclear with increasing risk. The risk is exemplified by the Technical Indicators, which are all pointing down and/or on a sell: my proprietary A.I. buy/sell indicator is on a sell, so is the MACD and the Money Flow Index shows that “Elvis left the building” early June: similar prices, while much less money is flowing in the market. This can of course all change, but for now these are negatives.

3rd party Ad. Not an offer or recommendation by Investing.com. See disclosure here or remove ads .

Hence, a break of SPX2416 tells us the larger correction to low 2300s is underway and I then expect one more larger wave up up to complete this Bull by Spring 2018.

Latest comments

Risk Disclosure: Trading in financial instruments and/or cryptocurrencies involves high risks including the risk of losing some, or all, of your investment amount, and may not be suitable for all investors. Prices of cryptocurrencies are extremely volatile and may be affected by external factors such as financial, regulatory or political events. Trading on margin increases the financial risks.
Before deciding to trade in financial instrument or cryptocurrencies you should be fully informed of the risks and costs associated with trading the financial markets, carefully consider your investment objectives, level of experience, and risk appetite, and seek professional advice where needed.
Fusion Media would like to remind you that the data contained in this website is not necessarily real-time nor accurate. The data and prices on the website are not necessarily provided by any market or exchange, but may be provided by market makers, and so prices may not be accurate and may differ from the actual price at any given market, meaning prices are indicative and not appropriate for trading purposes. Fusion Media and any provider of the data contained in this website will not accept liability for any loss or damage as a result of your trading, or your reliance on the information contained within this website.
It is prohibited to use, store, reproduce, display, modify, transmit or distribute the data contained in this website without the explicit prior written permission of Fusion Media and/or the data provider. All intellectual property rights are reserved by the providers and/or the exchange providing the data contained in this website.
Fusion Media may be compensated by the advertisers that appear on the website, based on your interaction with the advertisements or advertisers.
© 2007-2024 - Fusion Media Limited. All Rights Reserved.