As I observed over the last two weeks, most Fed presidents believe they have achieved their dual mandate – full employment and inflation near 2%. Today, I want to look at the counter-arguments to this assessment – that the U.S. is not at full employment and that inflation is in fact weaker than 2%. Assuming the following observations are accurate, then the Fed’s decision to raise rates over the next 18 months would be premature and potentially harmful to the economy.
Let’s begin with employment. The unemployment rate is a very low 4.3% and the U-6 rate is approaching lows seen before the recession. But despite these low numbers, overall wage growth is still weak:
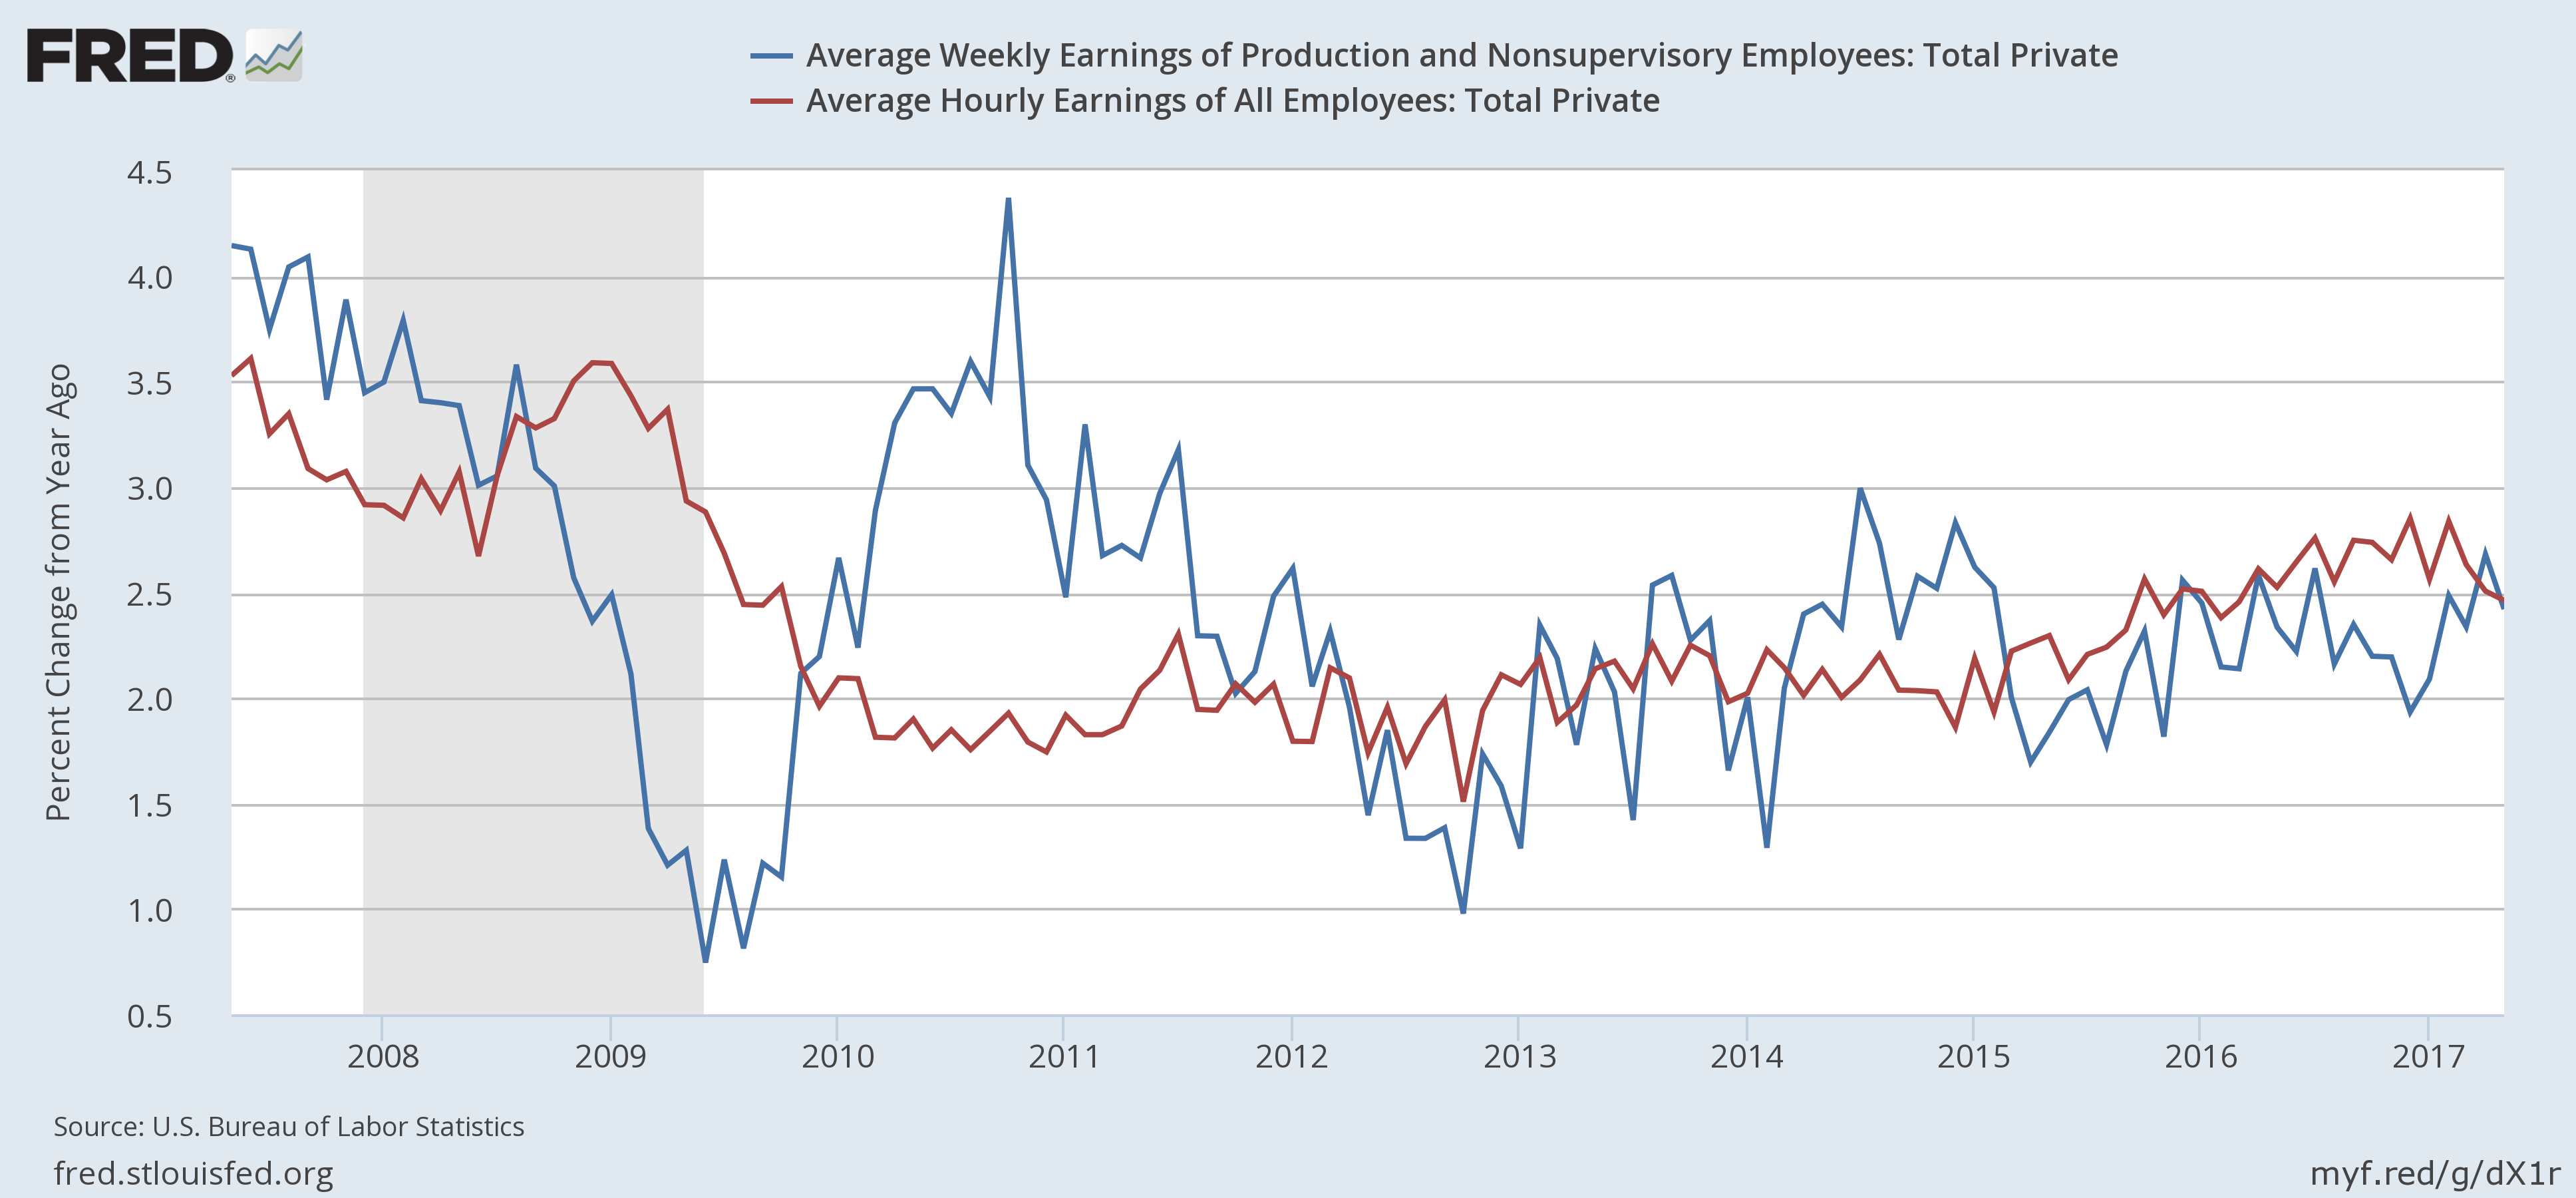
The Y/Y percentage change in the average hourly earnings of production workers is very subdued; it hasn’t broken 3% since the end of the recession. This indicates labor market slack may still exist, which is exhibited in the following charts:
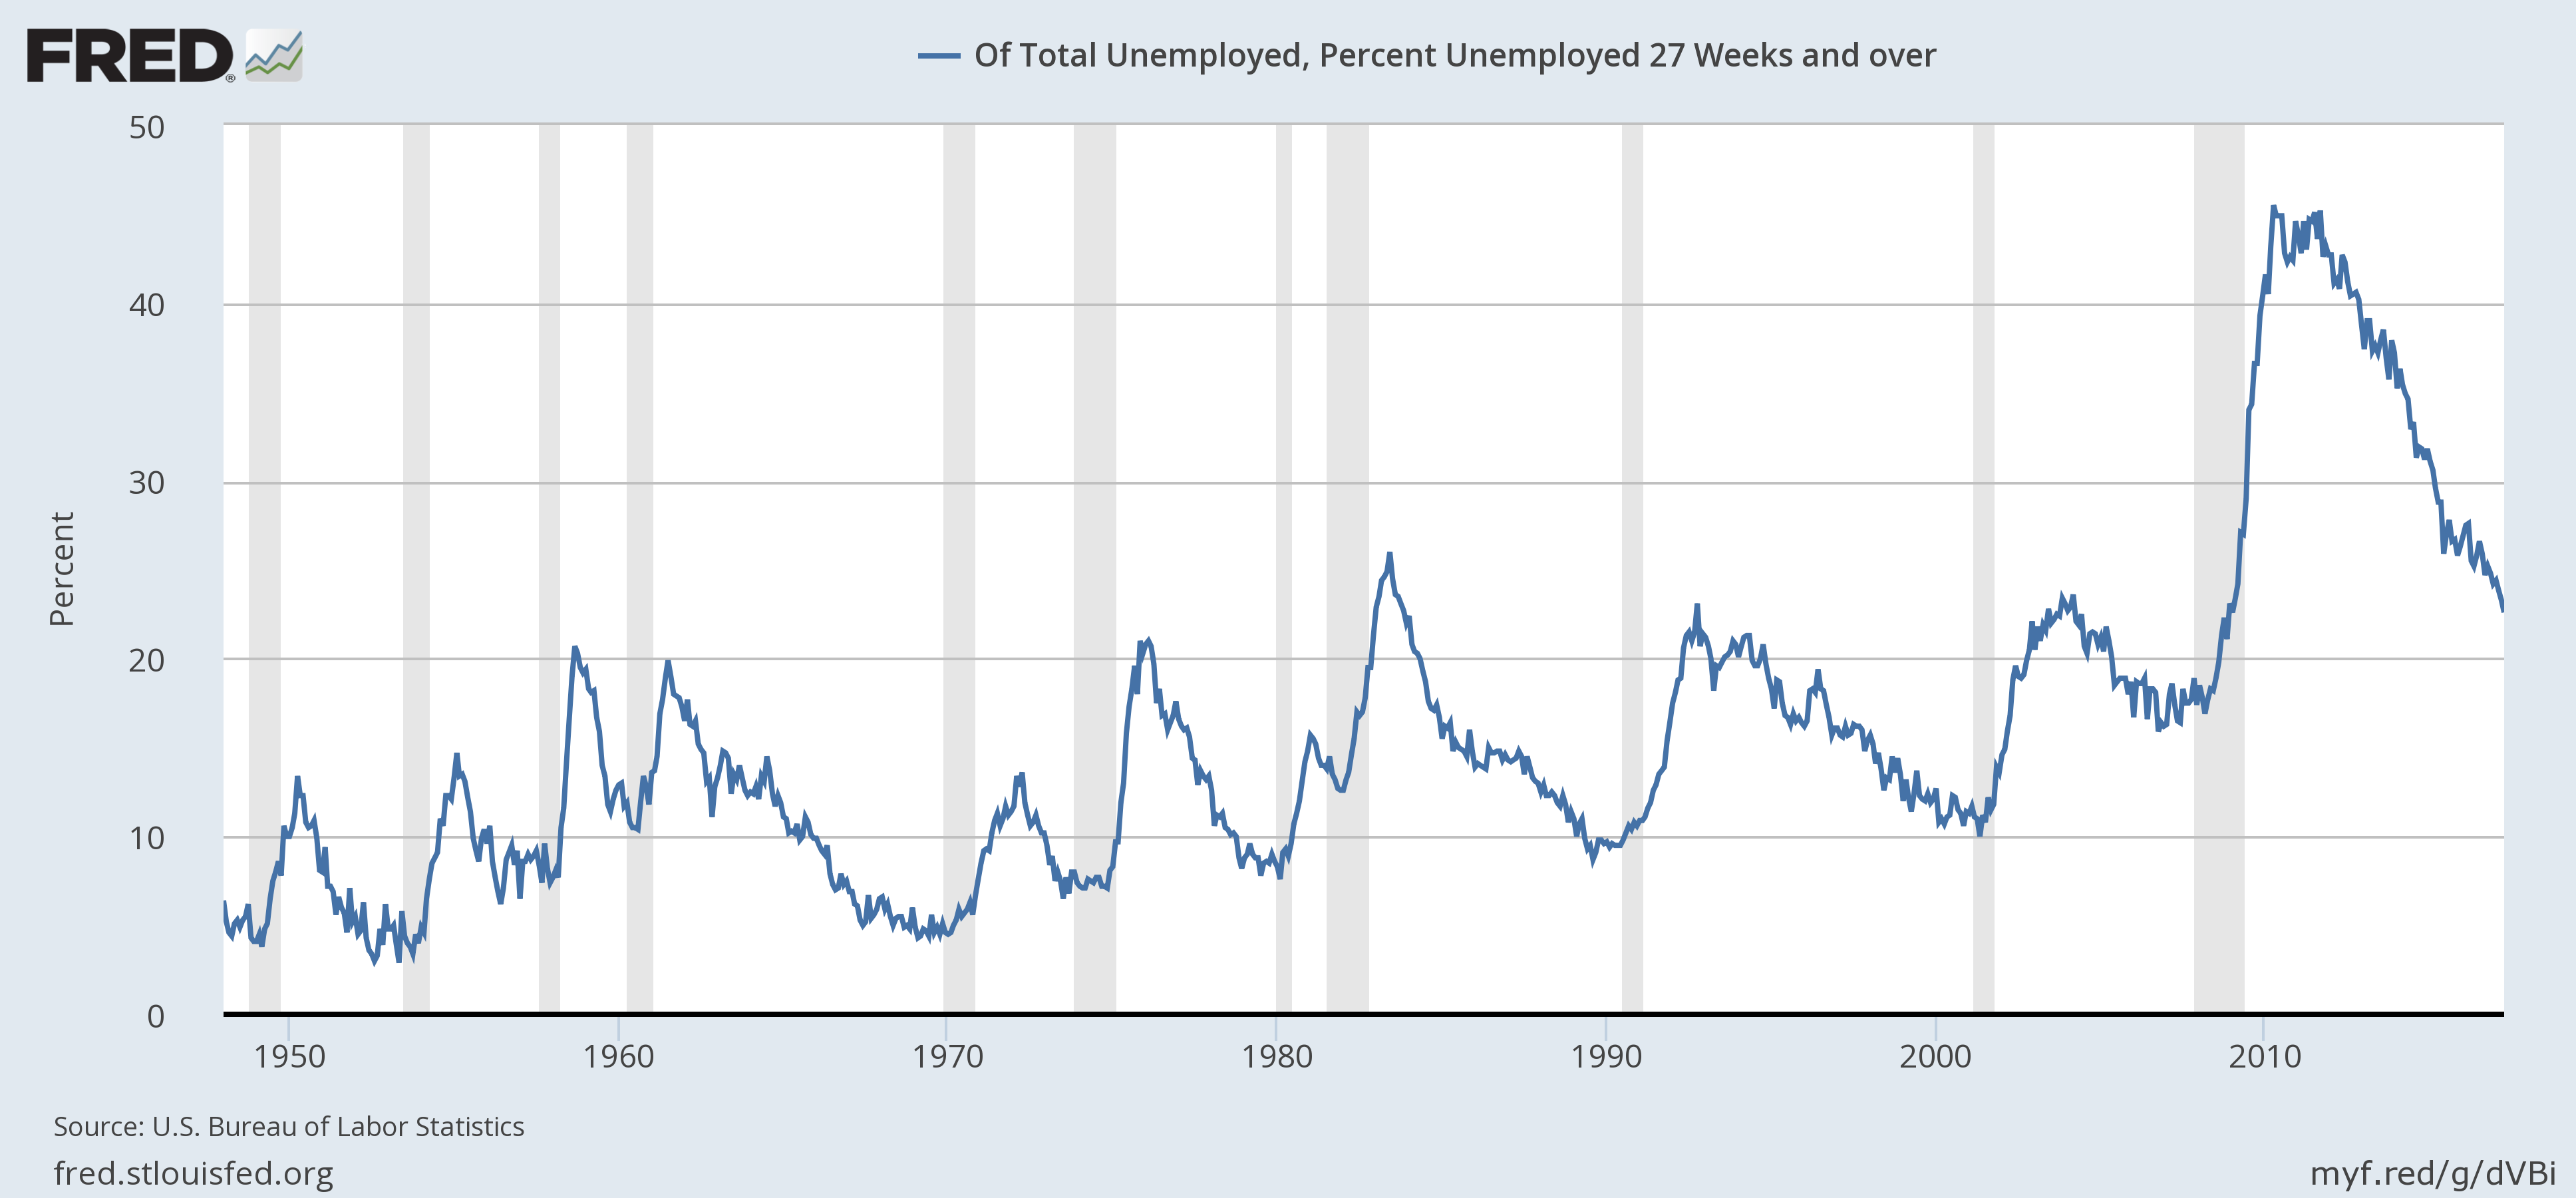
The percent of the unemployed who have been without a job over 27 weeks is still above its highest, pre-recession levels. This means that a group of the population was essentially cut out of the employment picture and has yet to return.
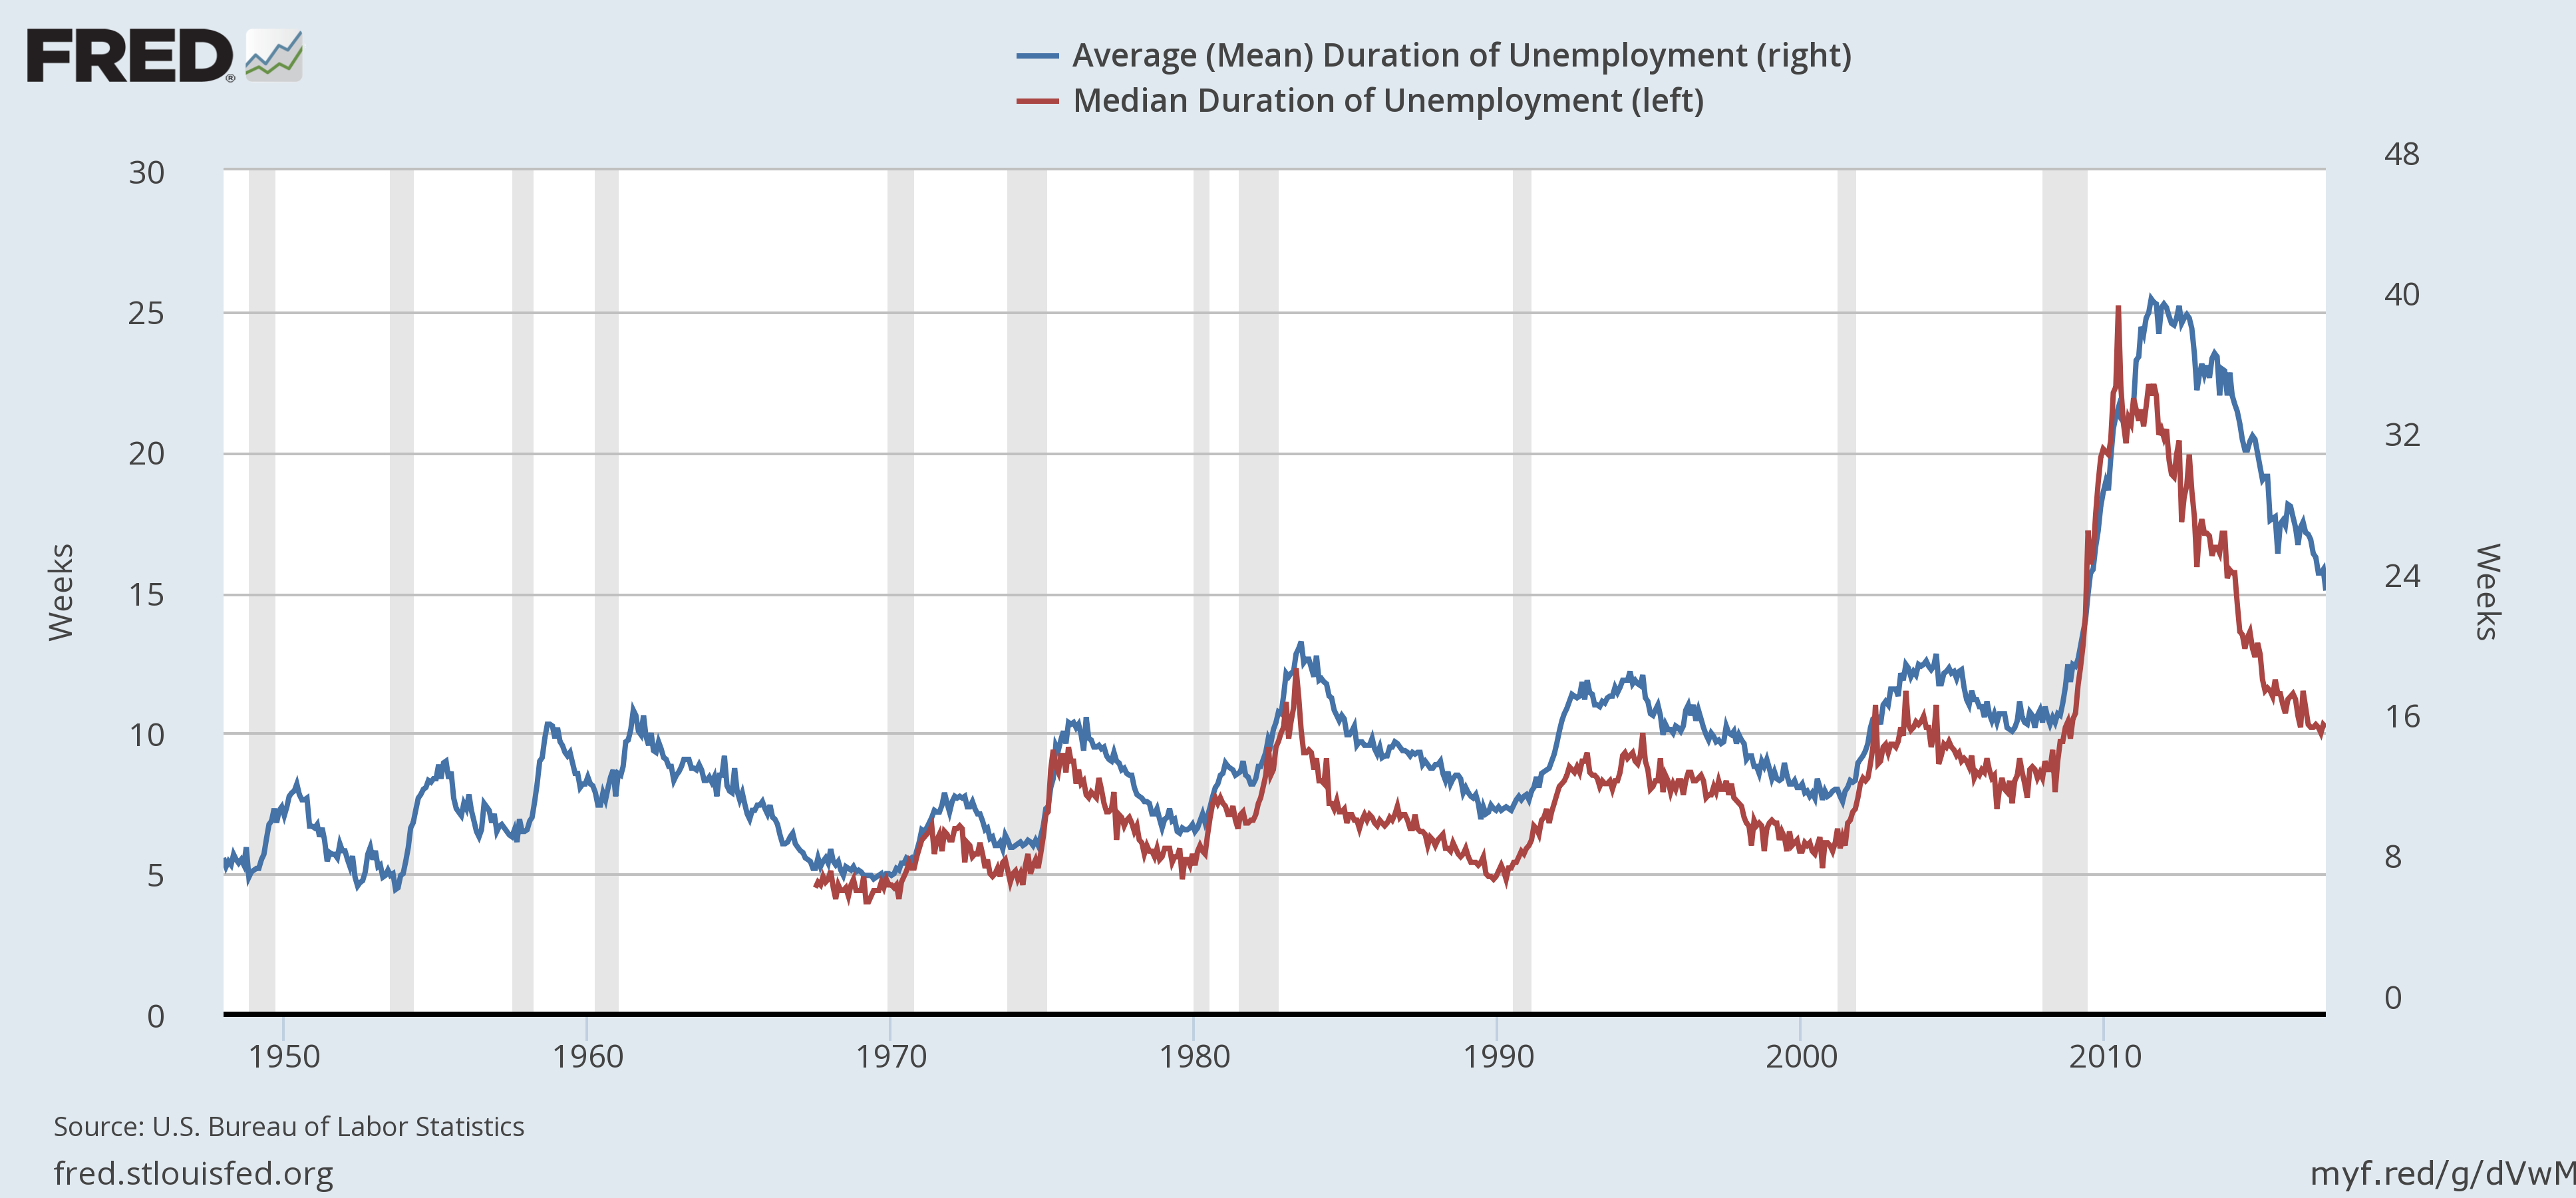
The median duration of unemployment (in red) is just at its pre-recession highs while the average duration of unemployment (in blue) is still above its pre-recession highs. This information corroborates the previous chart.
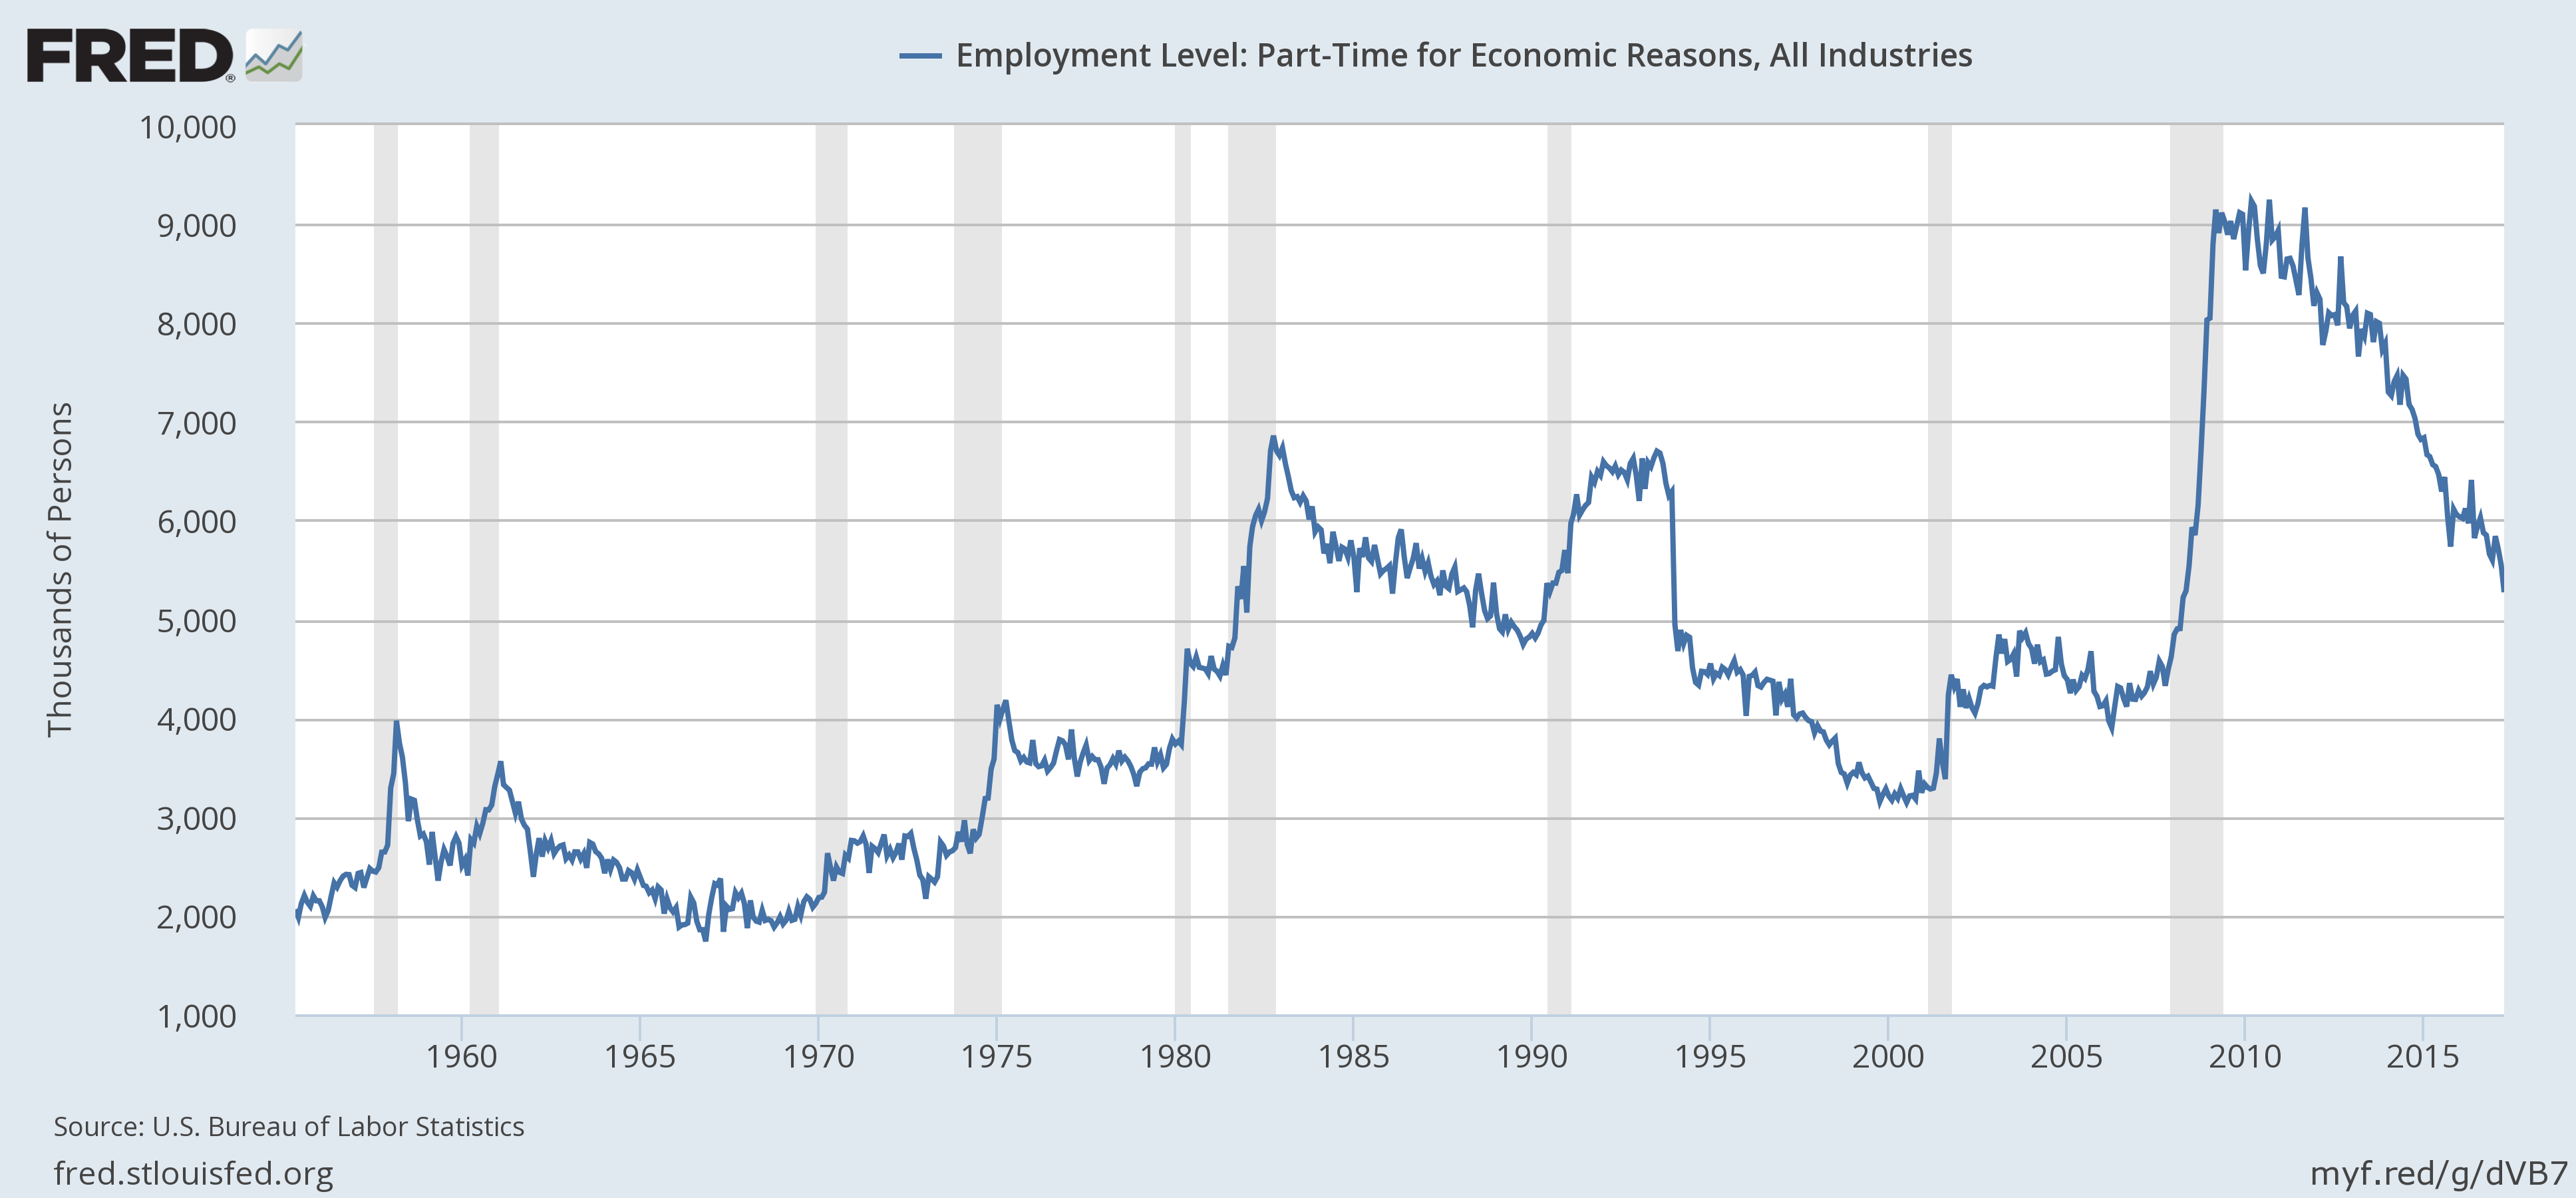
The number of people part-time for economic reasons is still above its pre-recession highs.
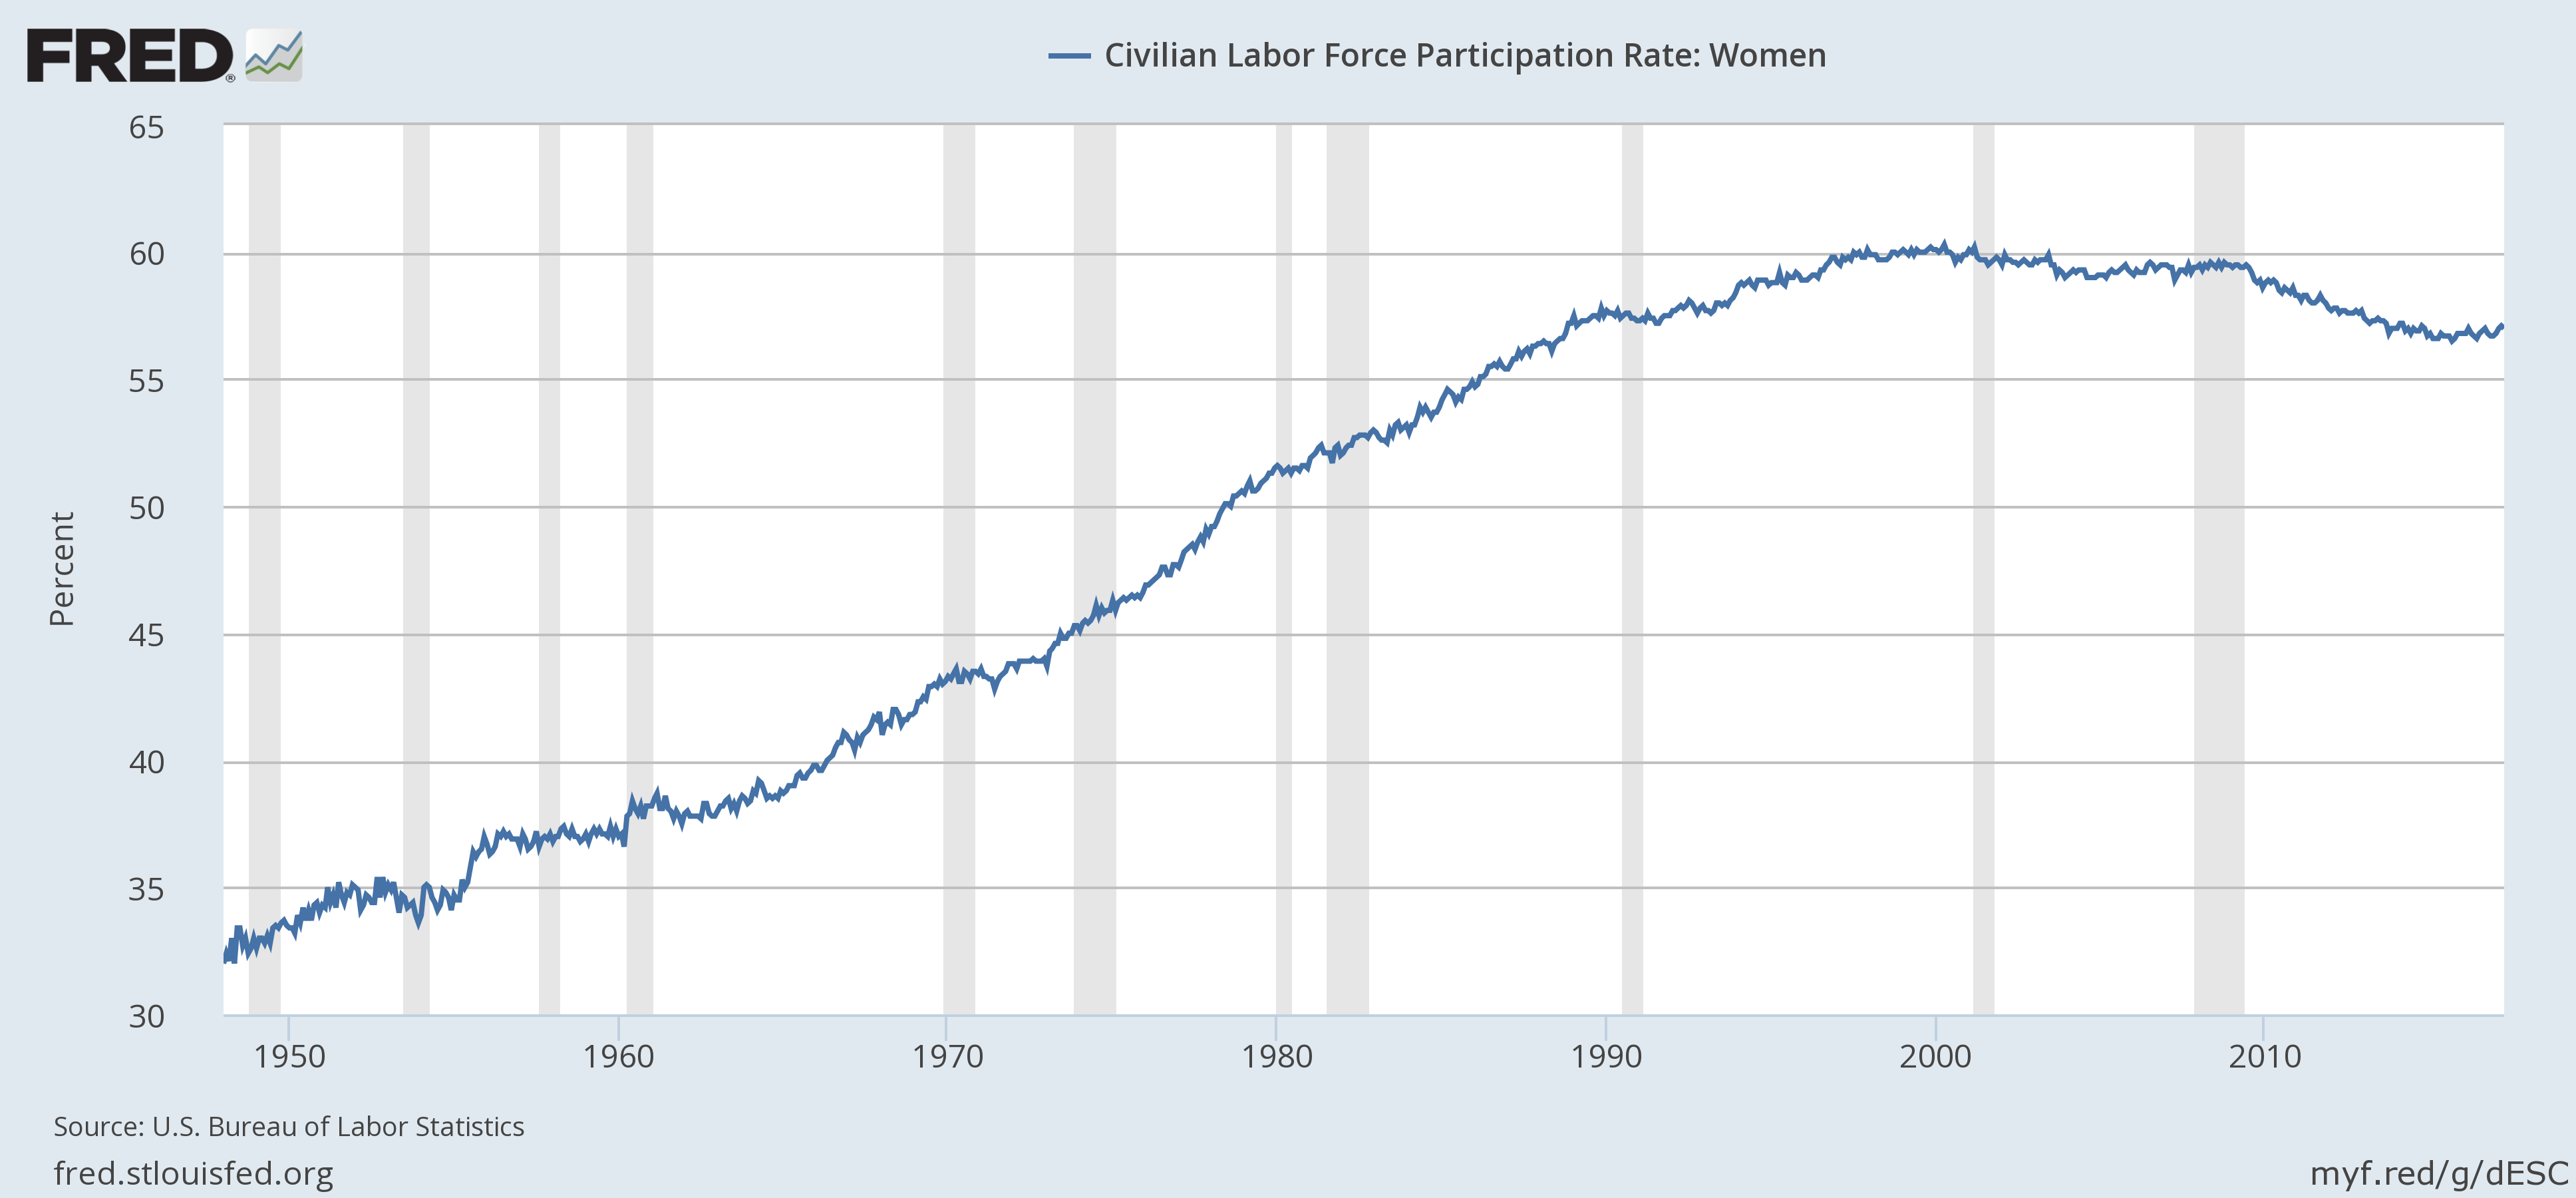
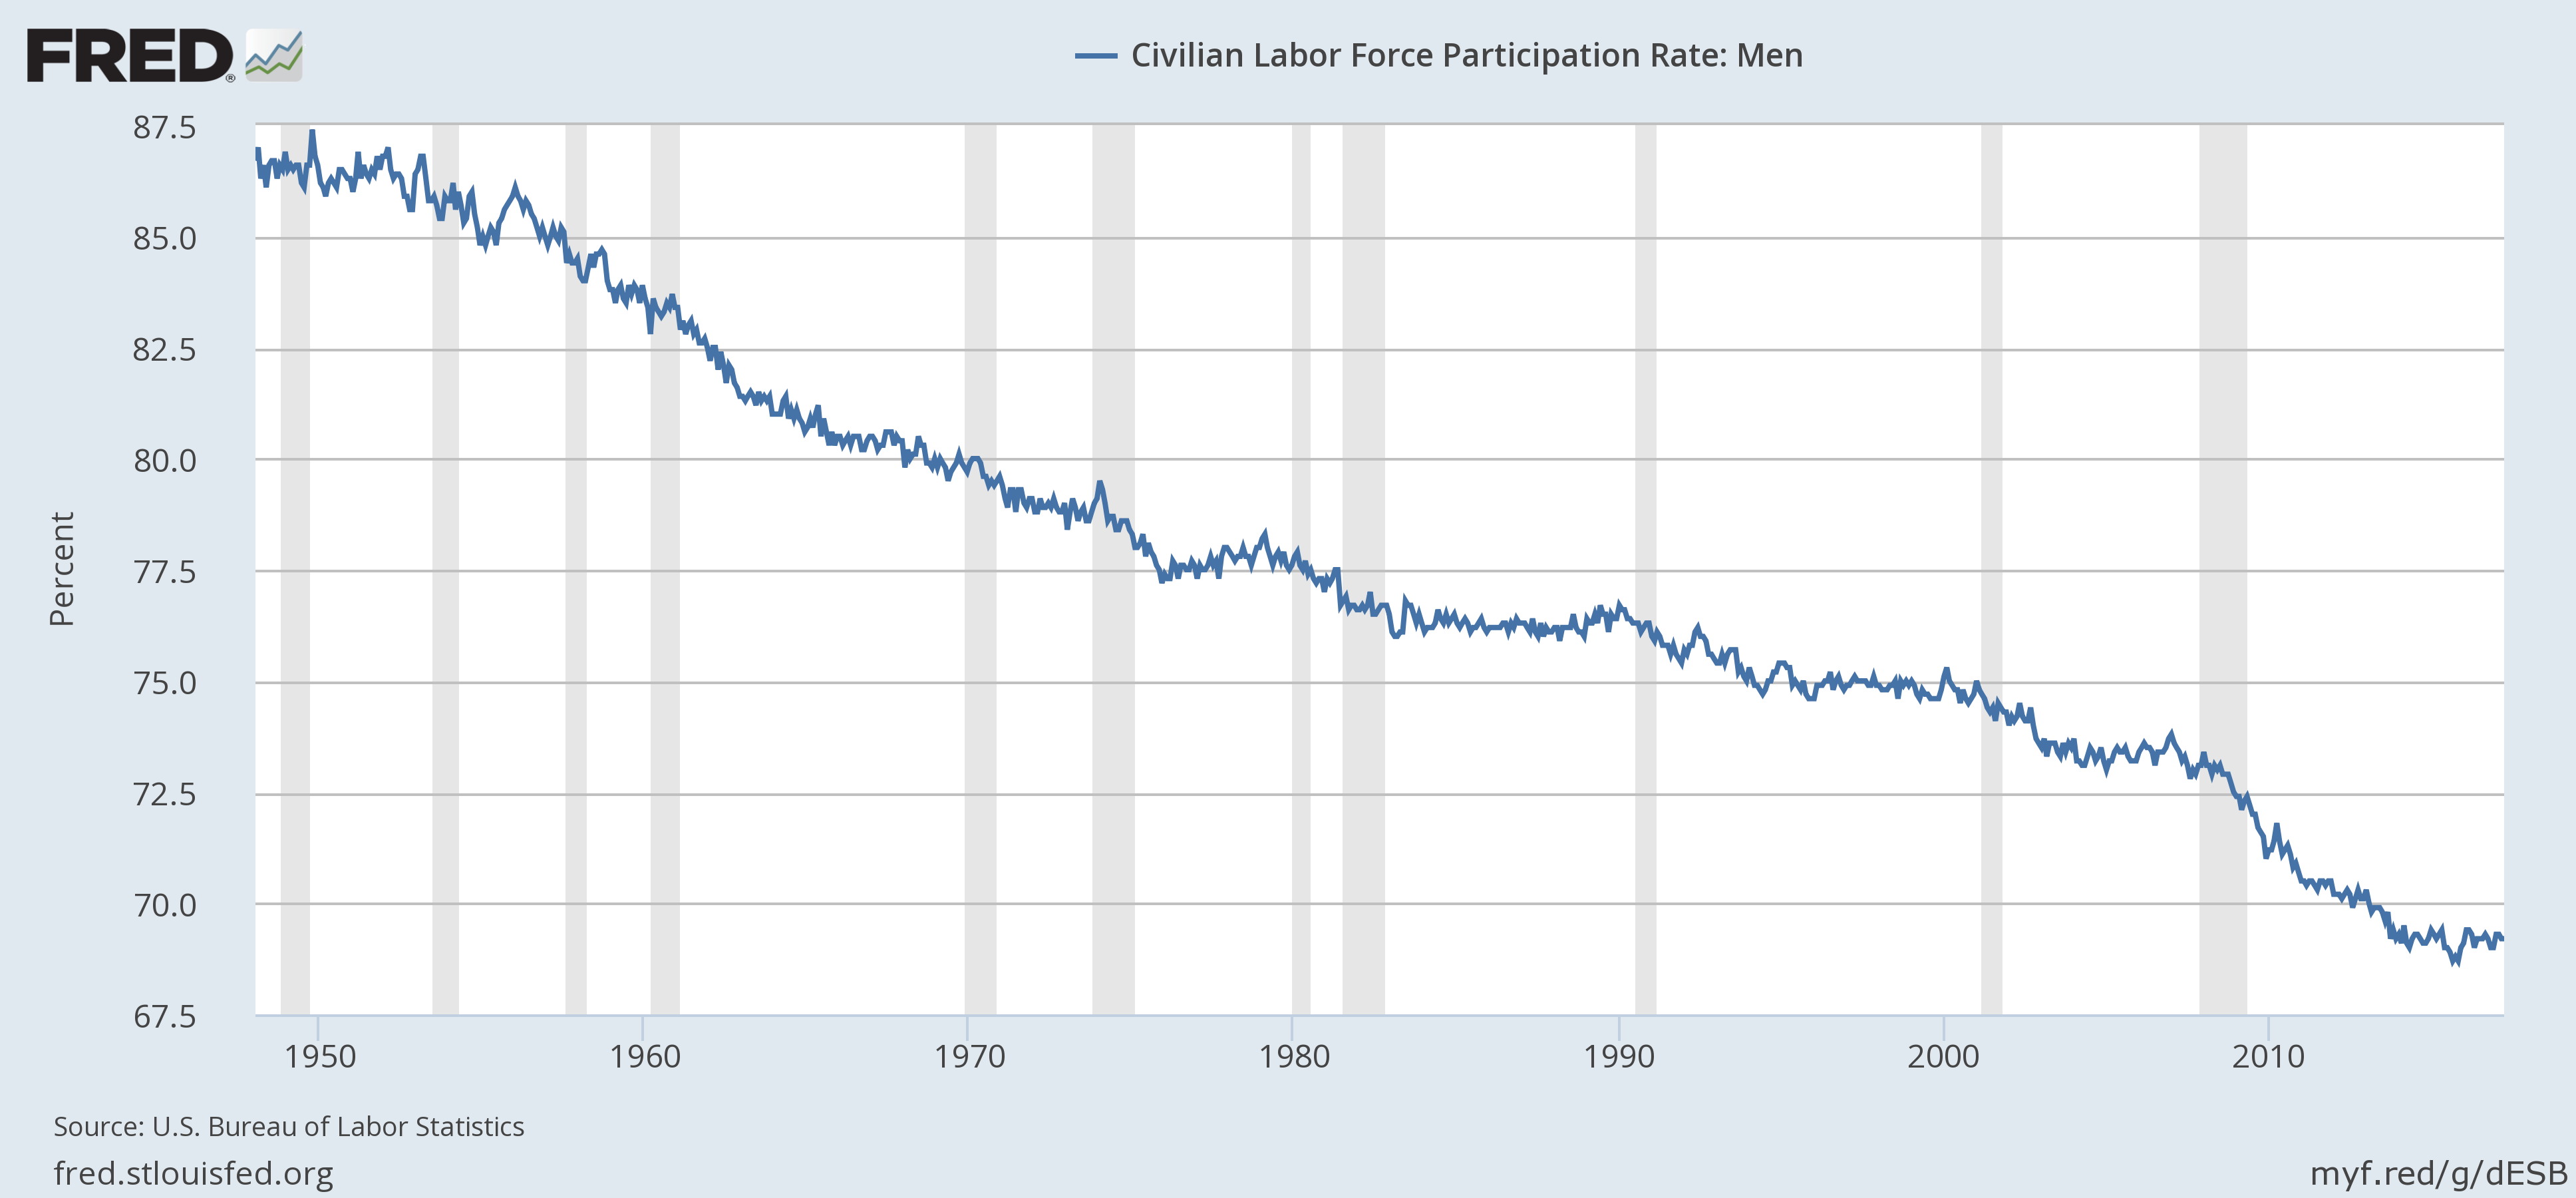
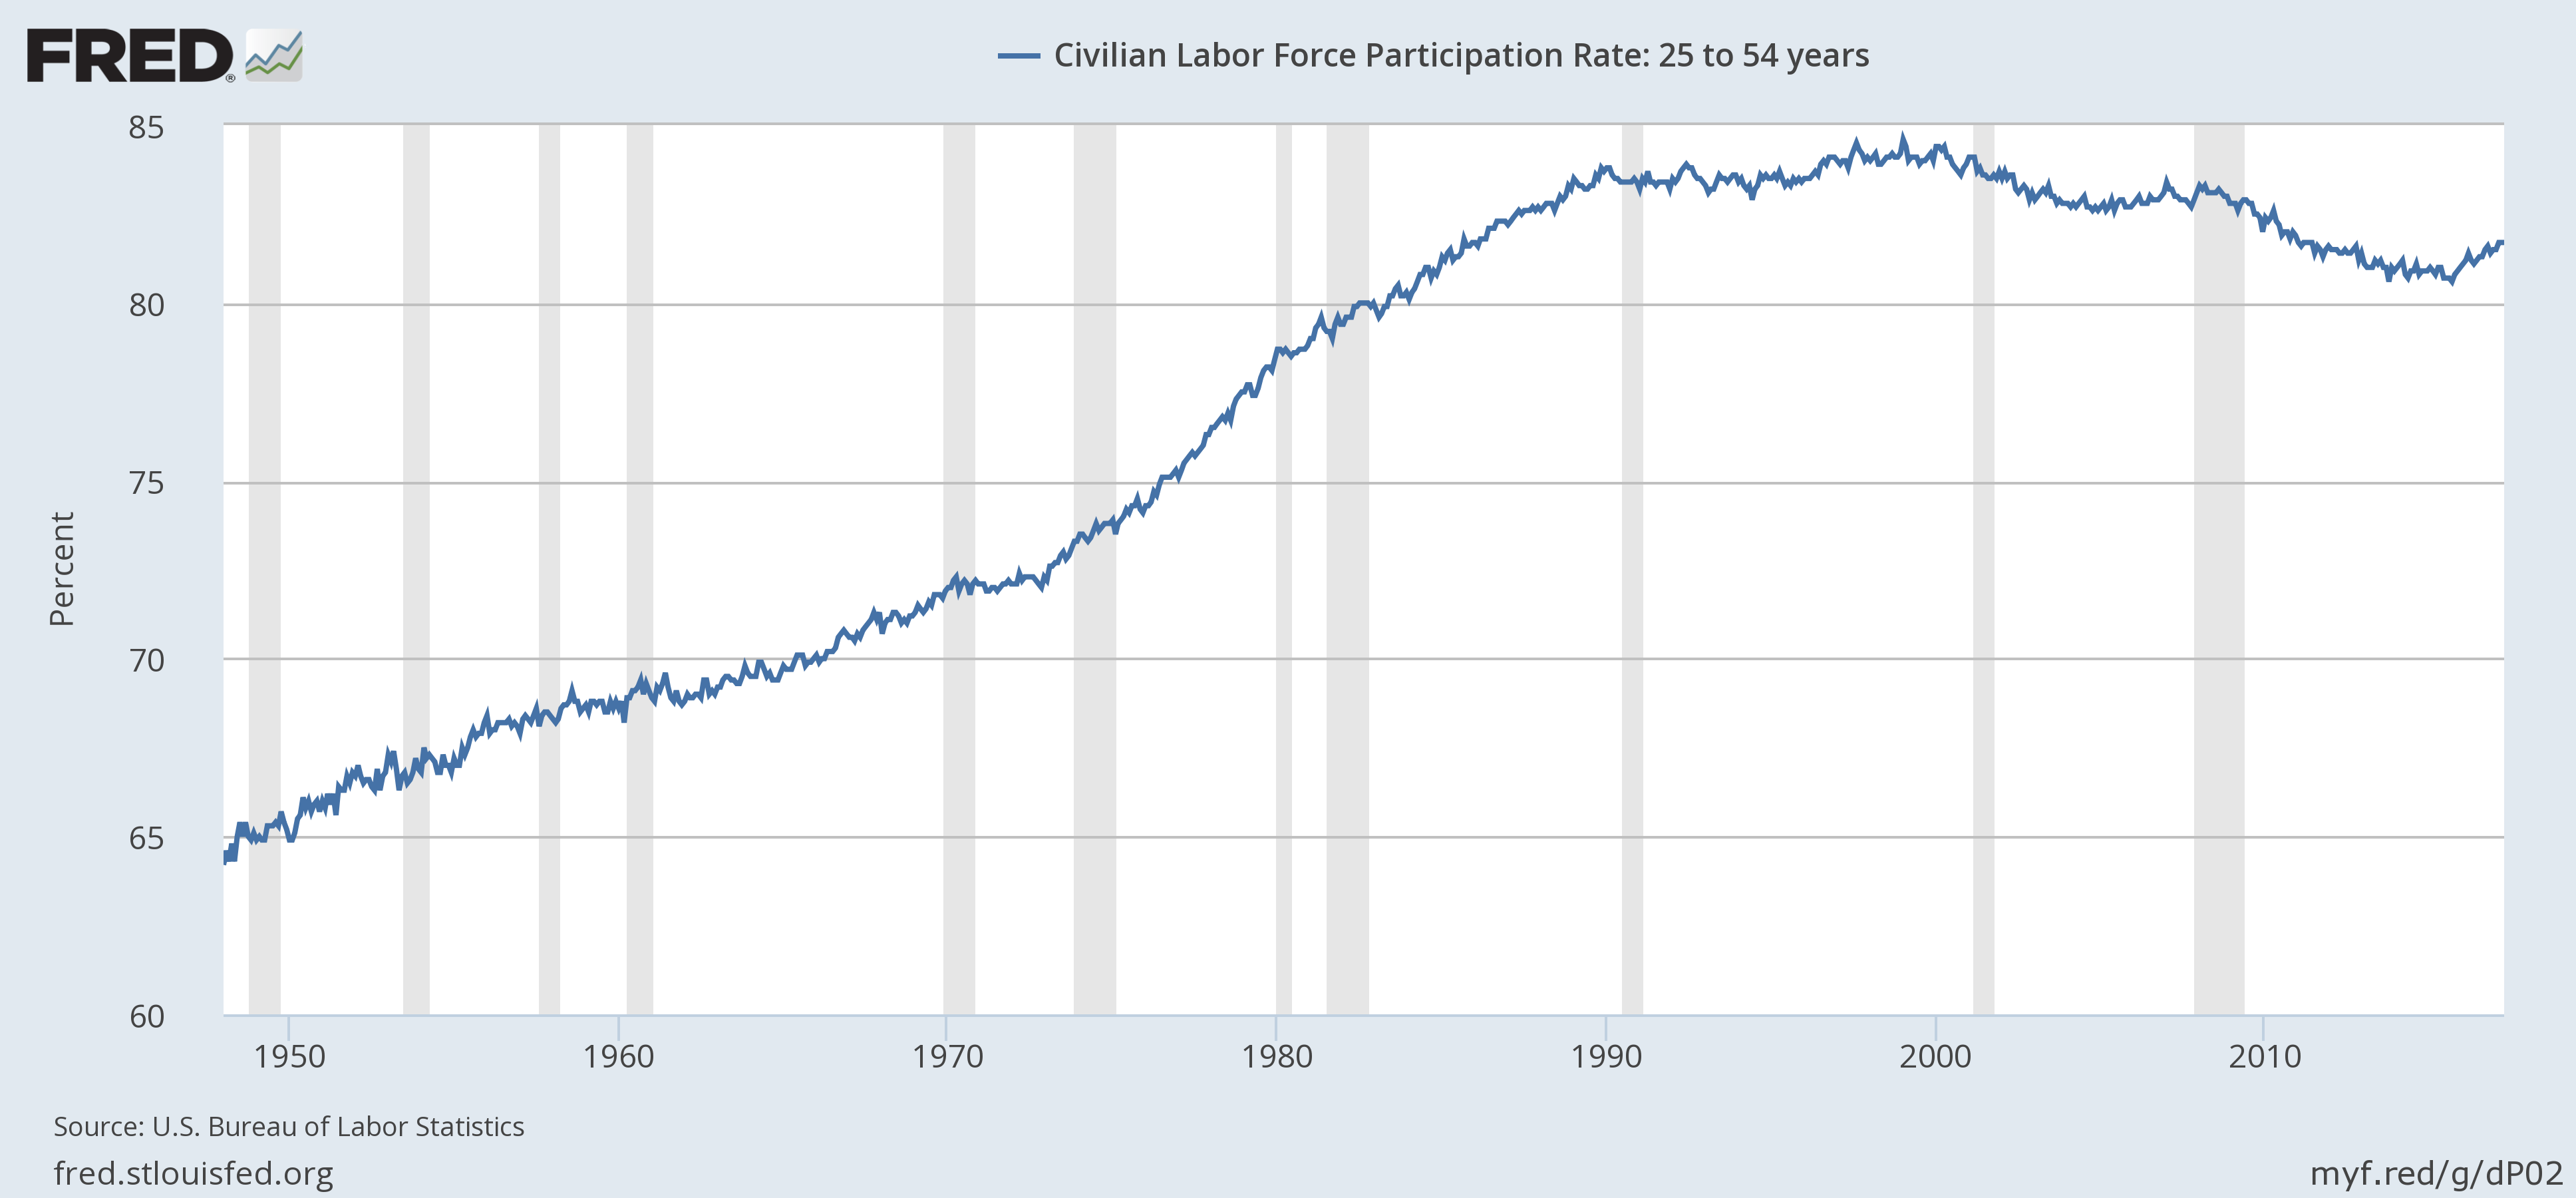
The three charts above illustrate the labor force participation rate for women (top chart), men (middle chart) and 25-54 year olds (bottom chart). All three are below their pre-recession highs. While the 25-54 chart is rising, it’s still below its pre-recession levels.
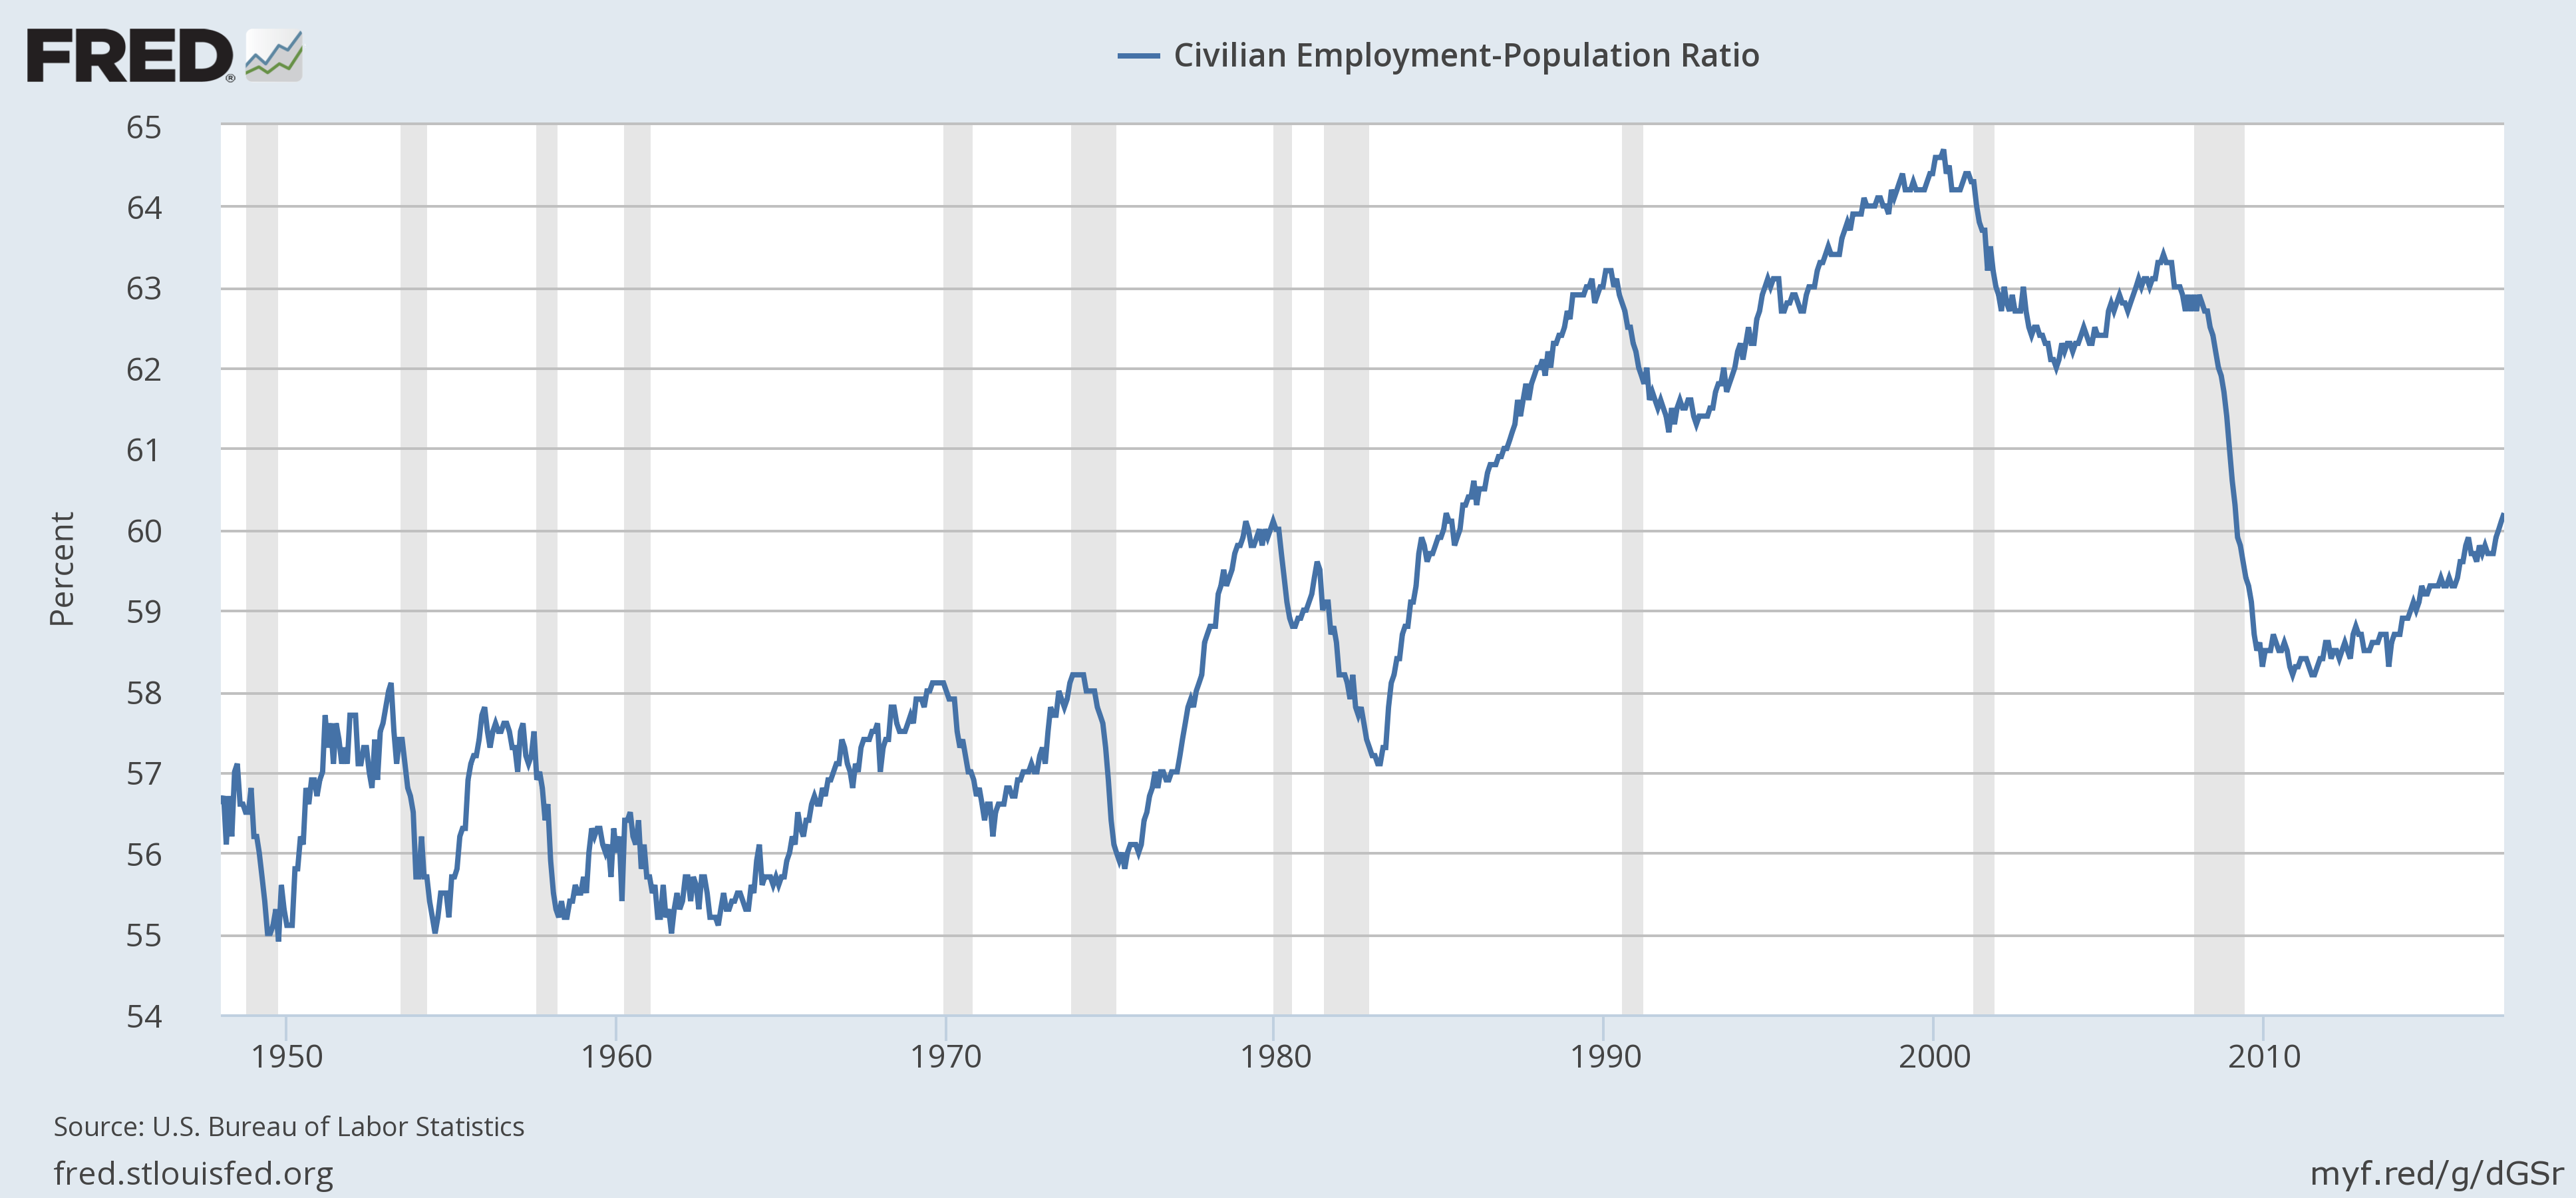
And finally, the employment/population ratio, while increasing, is still below its pre-recession lows.
There is general agreement among economists that retiring baby boomers will permanently lower the labor force participation rate, which also means the employment/population ratio along with other labor market data will be permanently weaker. Changing attitudes about family issues are probably contributing to the declining participation rate among women, while the increased education rate of 16-19 year olds has greatly reduced their participation. But slow wage growth could imply the labor market is weaker than the Fed believes.
Turning to prices, we have the following charts:
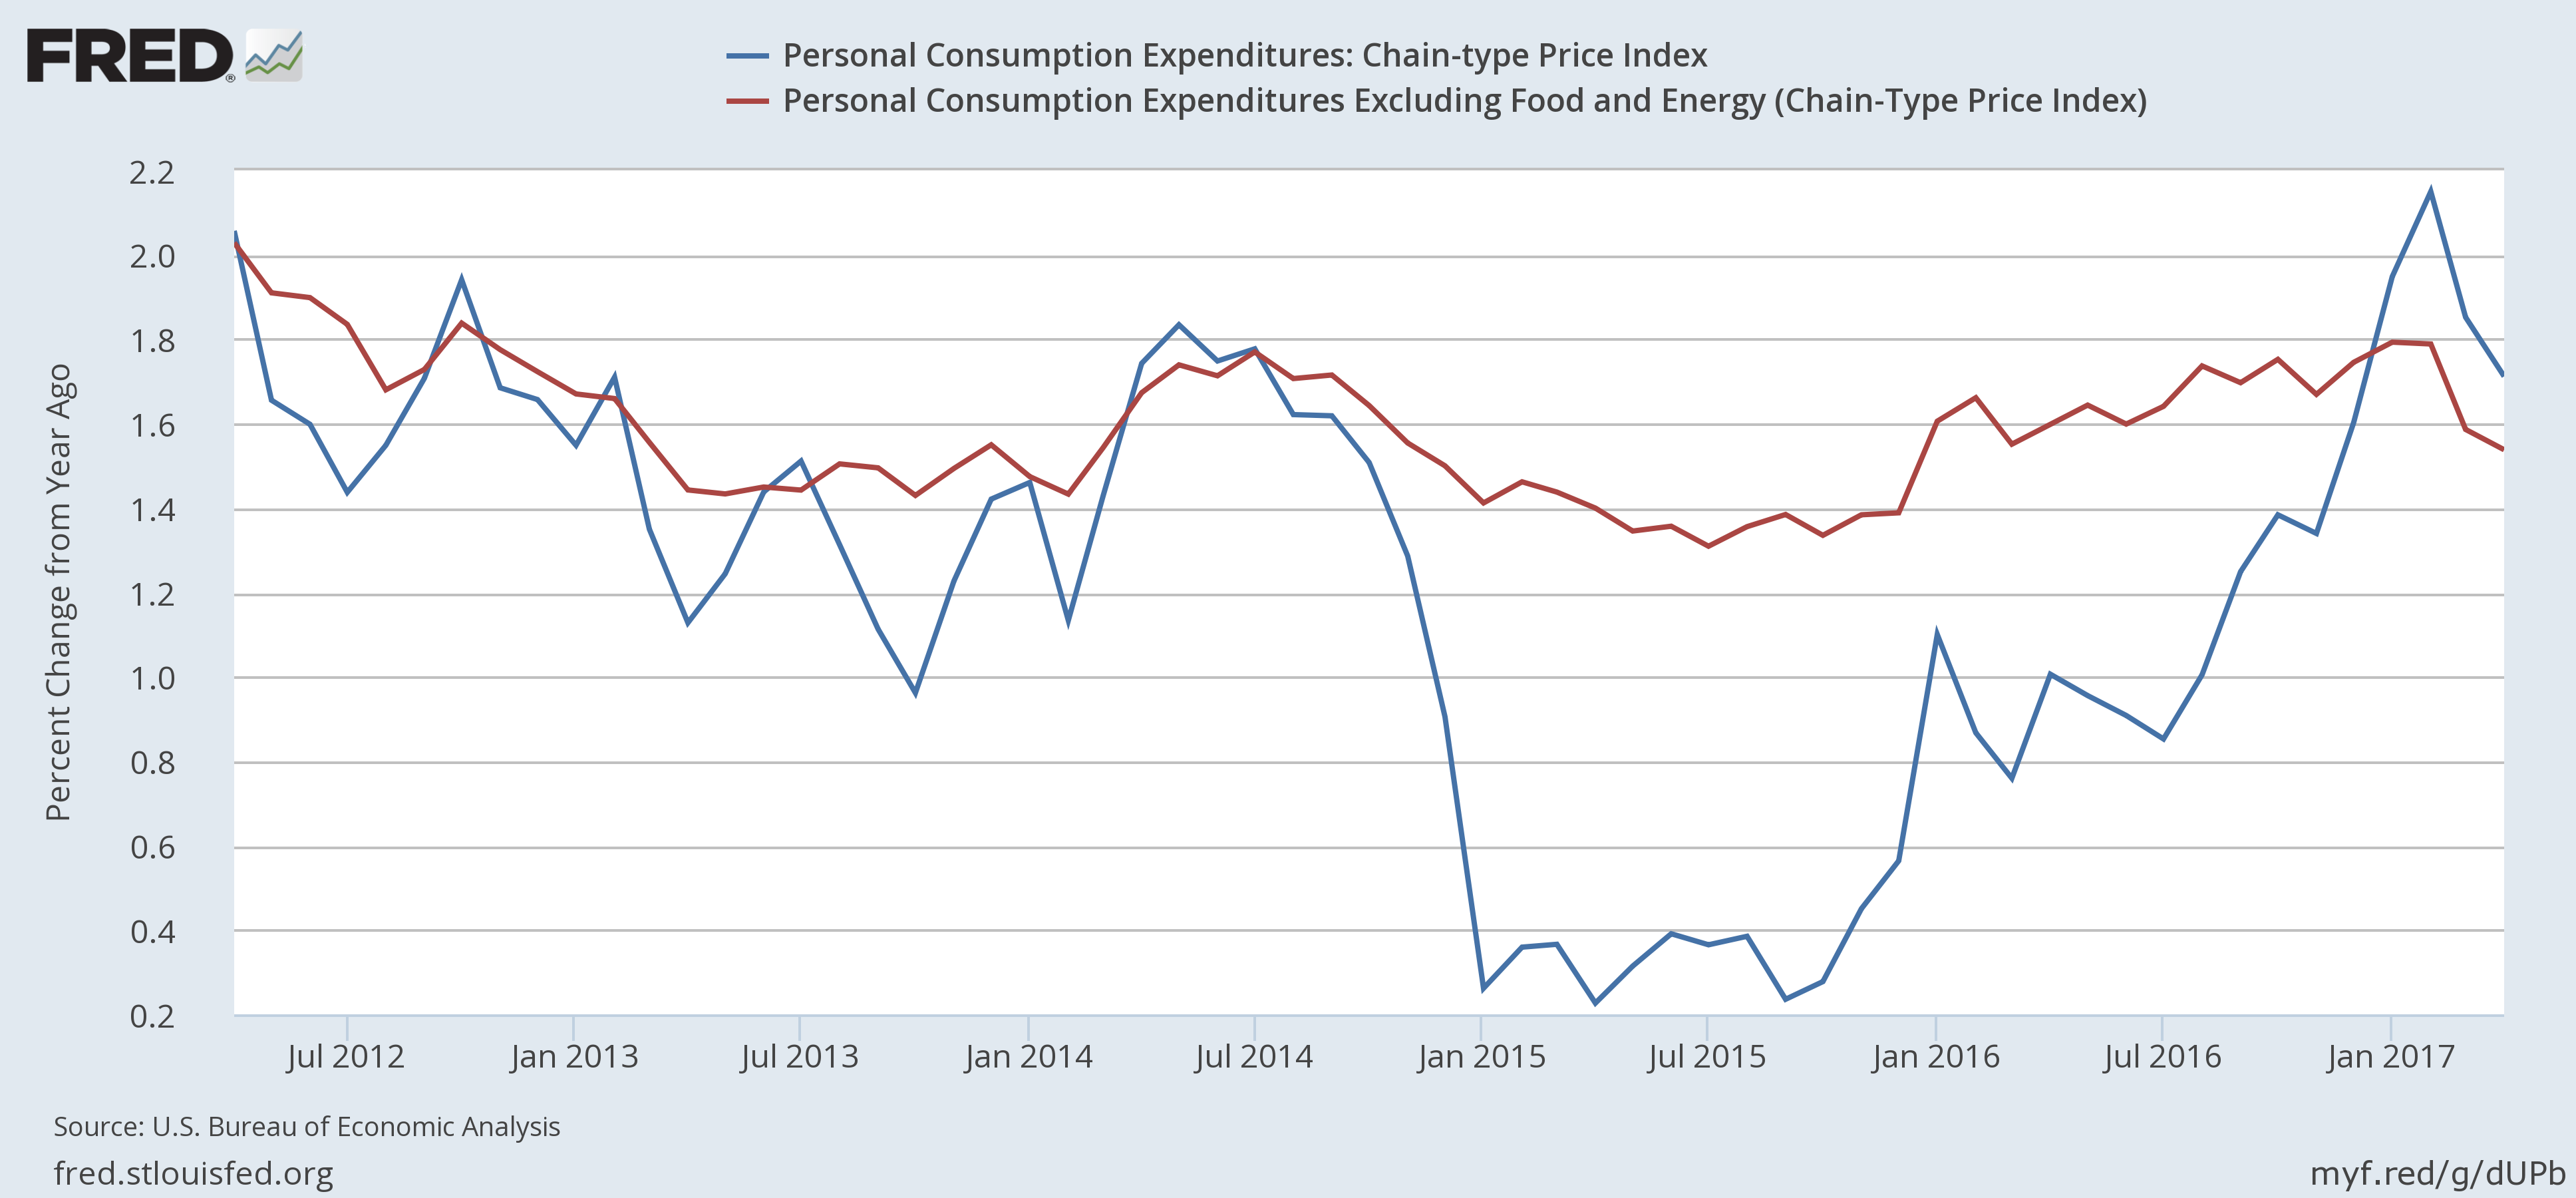
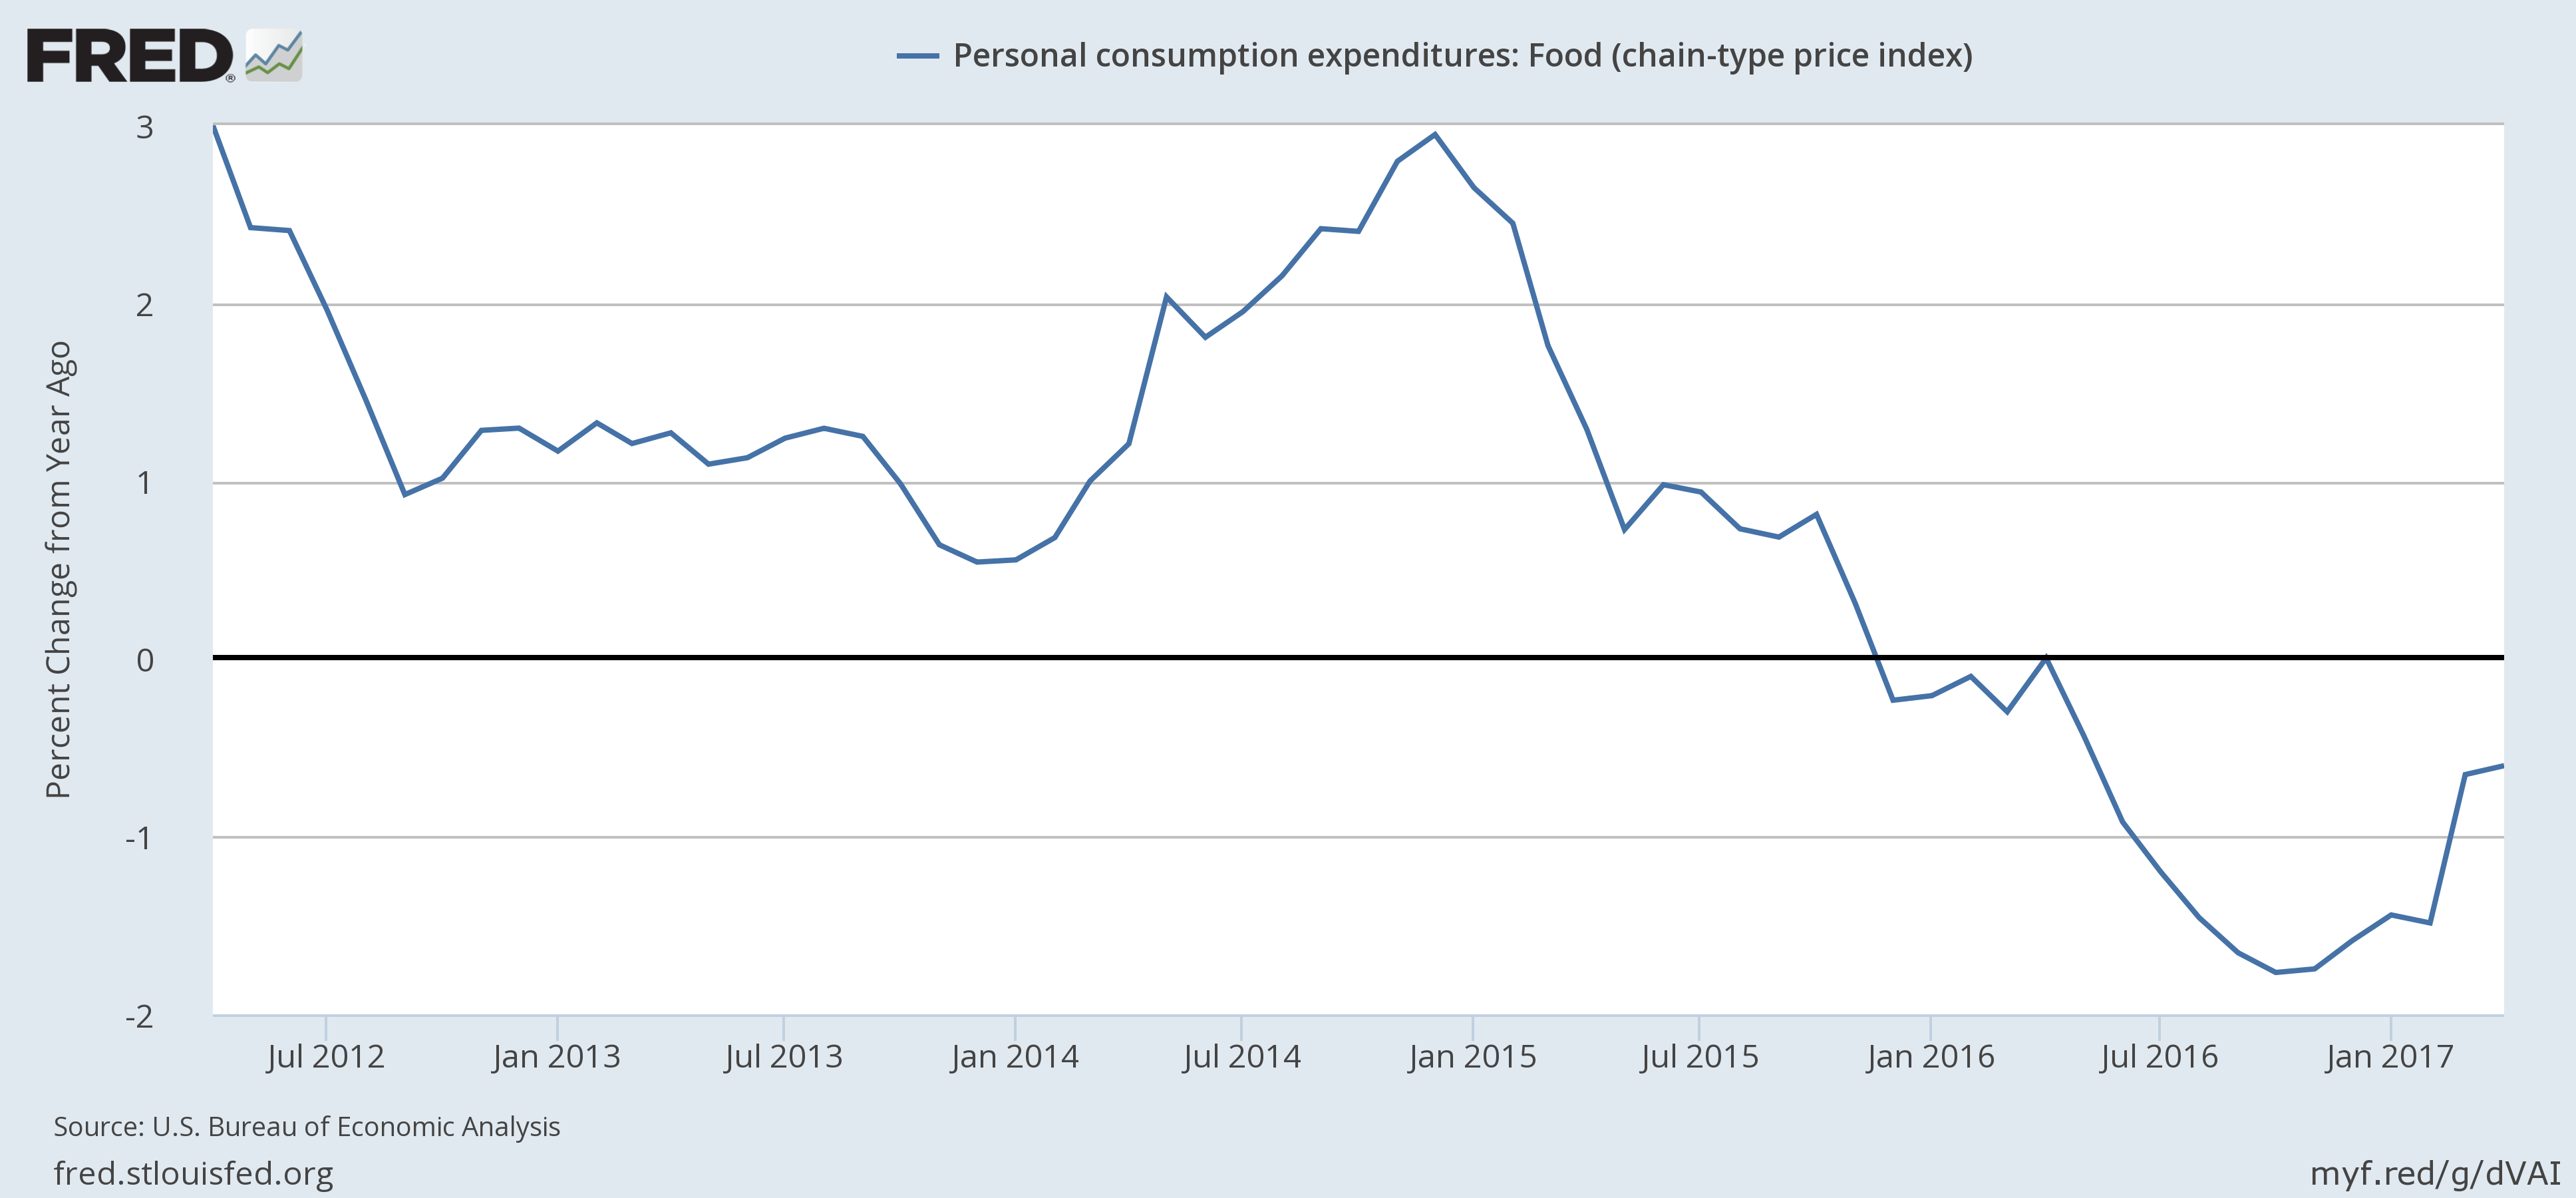
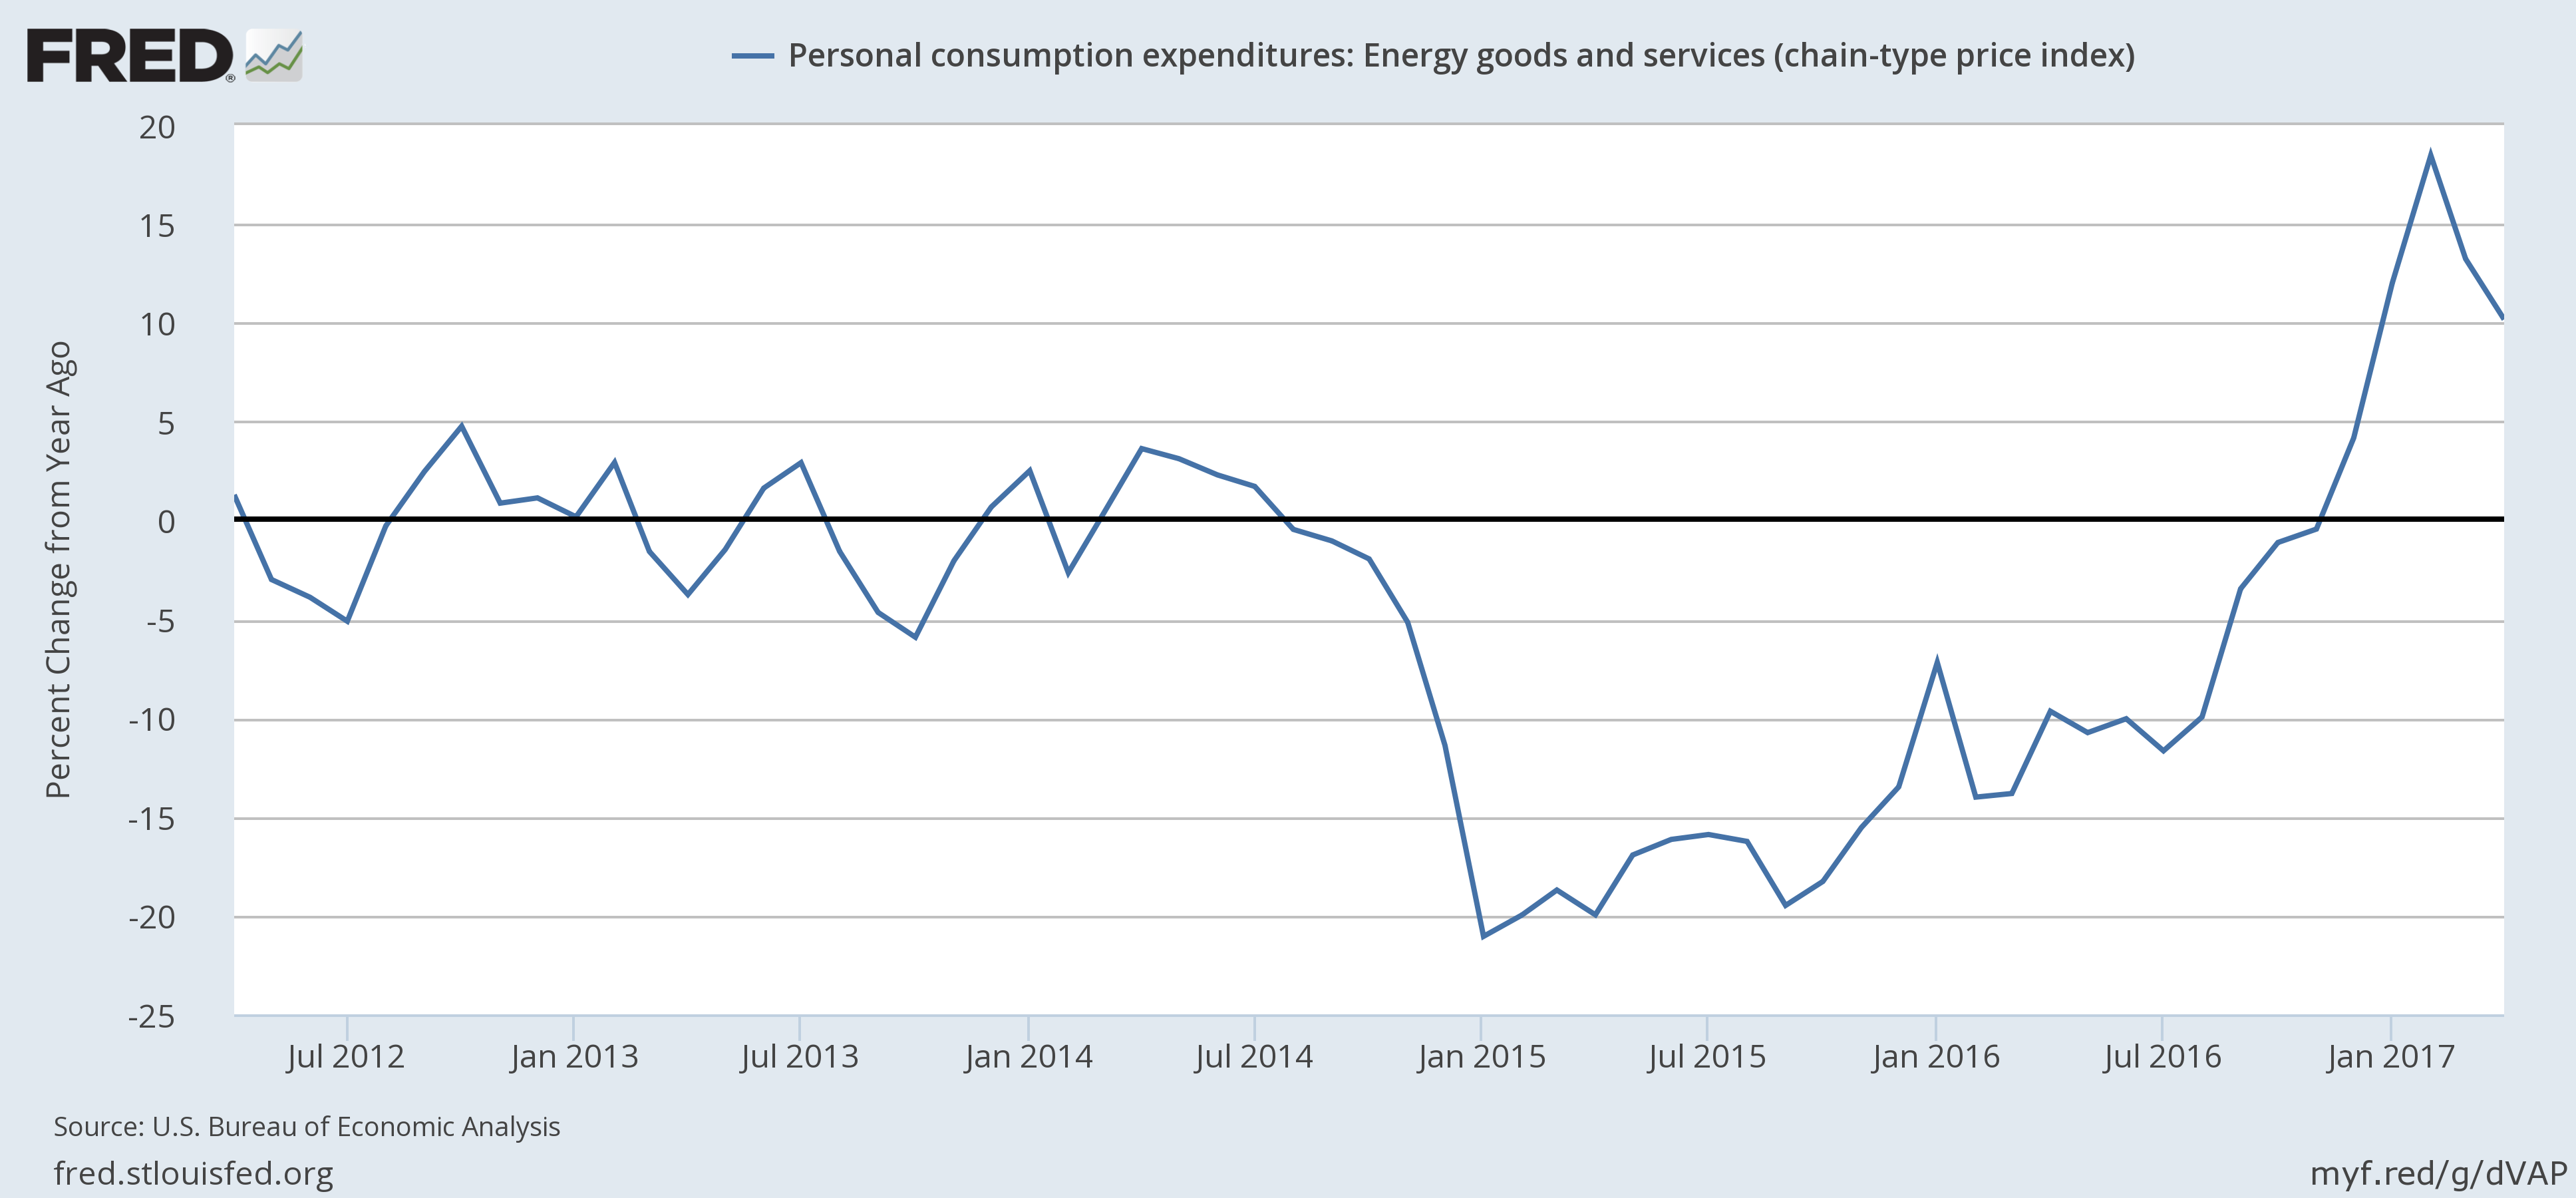
The top chart shows overall and core PCE price indexes. While the overall level briefly rose about 2%, it has returned to sub-2% readings. The middle chart shows food prices, which have been declining for two years, meaning they can’t be the reason for the increase in the overall PCE price index. The bottom chart shows that energy prices are obviously the primary driver of PCE price hikes.
But those prices recently decreased. And the price for West Texas Intermediate Crude has been moving sideways for the last year. One could reasonably conclude from the above data that prices are in fact weaker than thought. Neel Kashkari recently made this observation and Fed President Brainard hinted that weaker price data could change her mind regarding rate hikes.
Despite the Fed's hawkishness, it is possible to argue that employment and price weakness is still present, meaning the Fed should not be raising rates.
