Our research team believes Silver could be the Sleeper Rally setup of a lifetime for investors if the global economic cards continue to get scattered and crumpled over the next 10+ years. The recent rally in Gold got a lot of attention last Friday (the end of May 2019).
We had been warning about this move for the past 8+ months and generated an incredible research post in early October 2018 that clearly highlighted our belief that Gold would peak above $1300 early in 2019, then stall and move toward $1270 near April/May 2019, then begin an incredible upside price rally in June/July/Aug 2019. We couldn’t have been more clear about this prediction and we posted it in October 2018.
Now, our research team is going to share with you some incredible insights into what may become the most incredible trade setup we’ve seen in the past 12+ years – the Sleeper Silver Setup.
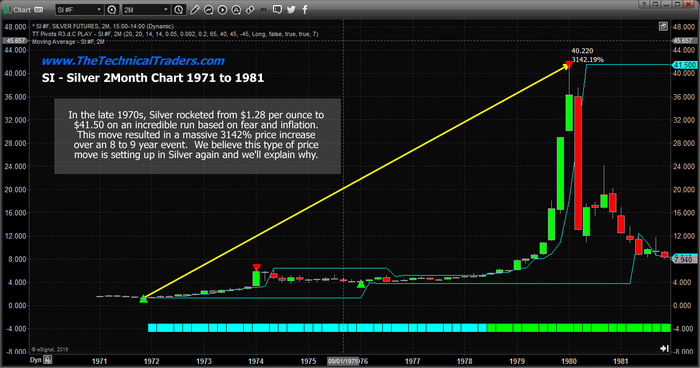
Going all the way back to the early 1970s, when the Hunt Brothers ran most of the metals markets, we can see the incredible price rally in Silver from $1.28 per ounce to nearly $41.50 in late 1979. This move setup with a very simple pattern – a high price breakout in 1973 that broke a sideways price channel and initiated a nearly 6+ year rally resulting in an incredible 3142% price increase from the lows.
Could it happen again?
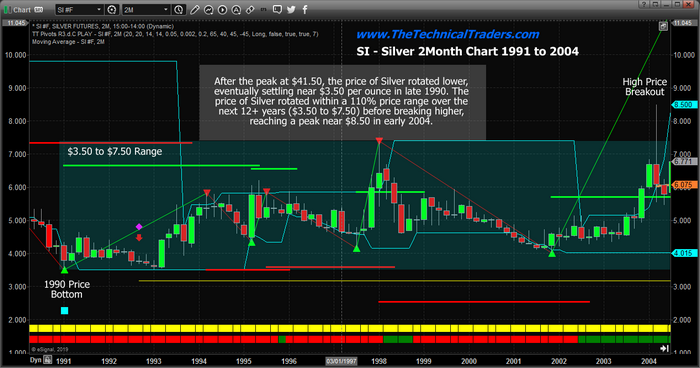
Well, after this incredible price peak, the price of Silver languished and moved lower, eventually bottoming in 1991 near $3.50. After that bottom setup, the price of Silver setup another sideways price channel and traded within this range until a 2004 High Price Breakout happened AGAIN. It seemed inconsequential at the time – a rogue high price near $8.50. Maybe that was it and maybe price would just rotate lower back to near the $4.00 range??
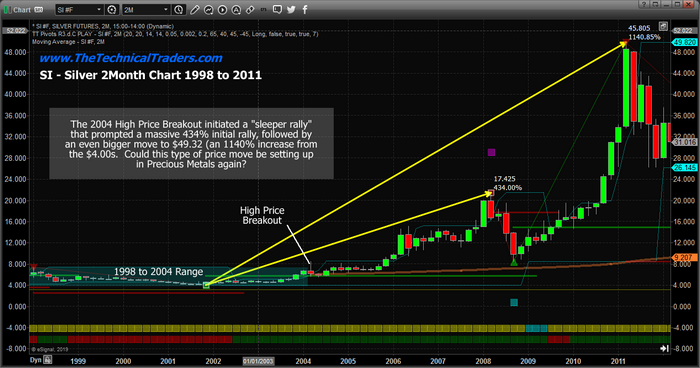
This High Price Breakout setup an incredible price rally that resulted in a continue price advance over the same 6+ year span of time. This rally was not as big as the 1974 to 1979 price rally in percentage terms, but it was much bigger in terms of price valuation. The 1979 price peak ended at $41.50 and resulted in a $40.25 price increase whereas the 2011 price peak resulted in a $46.32 price increase.
Will it happen again in our lifetime?
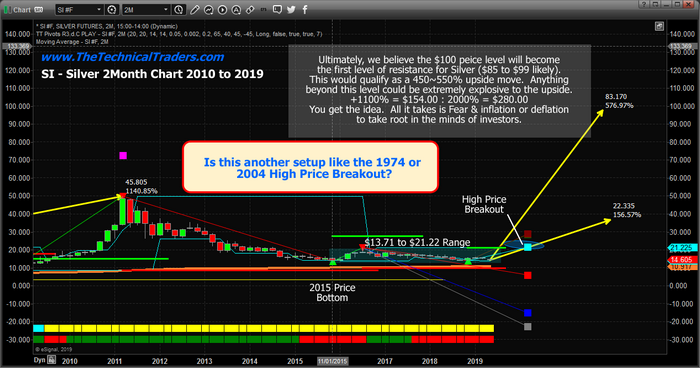
As incredible as it might seem, we believe Silver is setting up another High Price Breakout pattern that should conclude within the next 2 to 4 months with a price high near $22.50 to $24.00 (see our proprietary Fibonacci price modeling projections below). After this peak is reached, hold on to your hat because we believe the upside price rally could mimic past rallies and attempt to immediately move the price of Silver to well above $85 per ounce.
Ultimately, we can only guess as to where the top of this move may end – but we can safely estimate it will likely top somewhere between $90 and $550. This, of course, will require some type of major bear market is other asset classes and possibly some global crisis but we believe it is very possible in due time. Our predictive modeling systems will help us determine where the actual price peak will be as this unfolds over time.
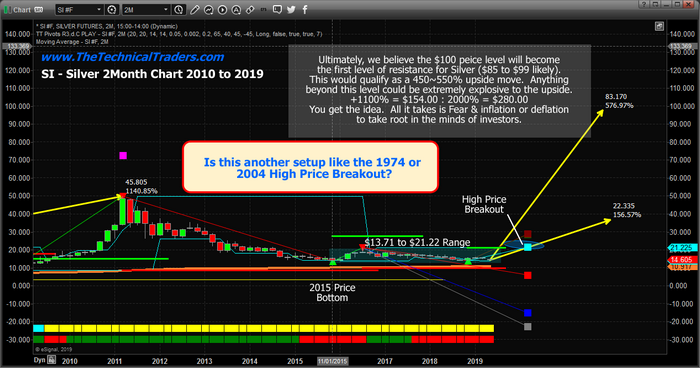
And there you have it – one of the most incredible trade setups you’ll ever see in your lifetime. Yes, it may happen twice in your life or more, but we believe this setup in Silver is just weeks or months from initiating the next upside price leg (the High Price Breakout) and we are alerting you now to be prepared.
