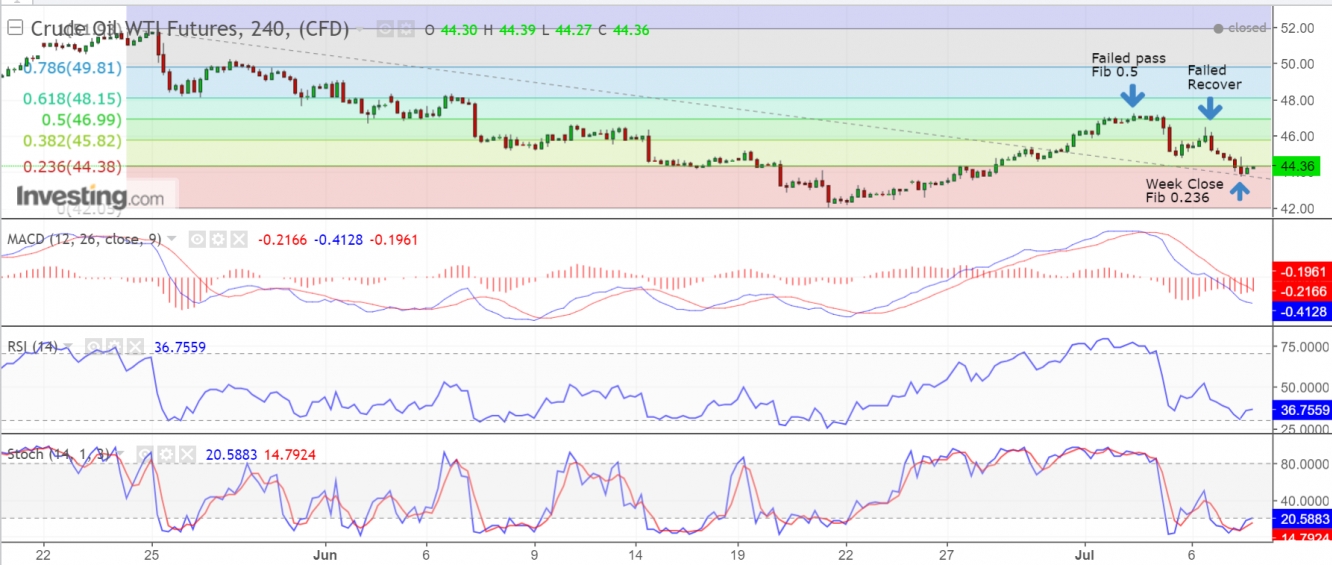
Oil had a massive reversal since Wednesday, I explained most of the reasons why I could reverse and why it was so drastic on my post “Why Did Oil Fall To A 5 Day Low?.” The question is, is there a chance for oil to go even lower, or are we seeing another reversal?
Baker Hughes didn’t help this time
BH Oil Rig count rose this week by 8 rigs after a 2 rig decline last week. On June 30, BH data encouraged traders to keep buying oil as production was slowing down, however it didn’t last long as on Friday release it showed more rigs were putting to work.
Volumes are Steady
Oil prices started to decrease on July 5, although it represents a significant difference from July 6 volumes. It’s quite normal as many traders close orders when they see high volatility. What’s interesting are the next two days which show almost the same volumes besides oil prices getting even lower.
We can interpret this in two ways, either traders are waiting a support price to be broken in order to open a new “Sell Position”, or traders are closing their active contracts to start a new “Buy Position” leading to a reversal. Either way, they indicate the same output. We need to wait for the market to react in order to understand next trend move.
API Oil Stock & Crude Inventories Fell
This week both API Weekly Oil Stock and crude oil inventories fell more than expected which is a result of the production fall last week. Although API had a big impact on oil prices managing to stop the massive plunge on July 5, crude inventories didn’t. In this scenario we can consider fundamental traders haven’t enough strength to drive the market, and data released, including the BH Rig Count, isn’t making much of a difference in oil prices.
The Big Picture
Technically speaking, oil can go either way at this point. We can see that 50% Fibonacci wasn’t passed, it consolidated for a while and started descending. Furthermore, it showed a level of recovery but failed to pass previous uptrends and broke a Fibonacci 38.2% heading to 23.6% where it closed for weekend.
Although 4H chart shows an oversold price, daily and weekly charts shows selling signal, which lets us know that there’s enough space for oil to keep falling.
If the oil trend is still bullish, corrections will be made 1/3 to 2/3 of the uptrend height, taking 2/3 of the current height support would be located at 44.28. It seems at this stage that support is respected and bounced up, however, it’s to premise getting to a firm conclusion for now.
I recommend acting depending on which scenario is achieved. If oil breaks down $42.5, most likely scenario is bearish and probably oil will break the downtrend channel leading to a further support of $39. On the other hand, to confirm a bullish continuation, the price would need to pass Fibonacci 38.2% and further resistance $47.


