Get 40% Off
⚠ Earnings Alert! Which stocks are poised to surge?
See the stocks on our ProPicks radar. These strategies gained 19.7% year-to-date.
Unlock full list

Is Nasdaq 100's Correction Happening?

Published 02/26/2021, 02:44 PM
Updated 07/09/2023, 06:31 AM

In last week’s article, based on the Elliott Wave Principle (EWP ) and technical analysis, I concluded the Nasdaq 100:

“…Two weeks ago, I found, [wave-iv] should see a retest of the 12830s level once again before moving higher to the low-14000s. I can now update this to intermediate wave-iv is now likely under way, and although it can even make a new all-time high, it should ideally target 12800-13200 before the index rallies, most likely, one last time since the rally in March 2020 started.

Even in late-January (see here) I thought the index would top around 13810-14125 and then drop 12825-13120 before moving higher to the low 1400s. Although the index took a slight detour with the late-January low, as one cannot always foresee every single market turn, the index complied rather well overall. It erased all the prior gains as I anticipated in early February (see here).

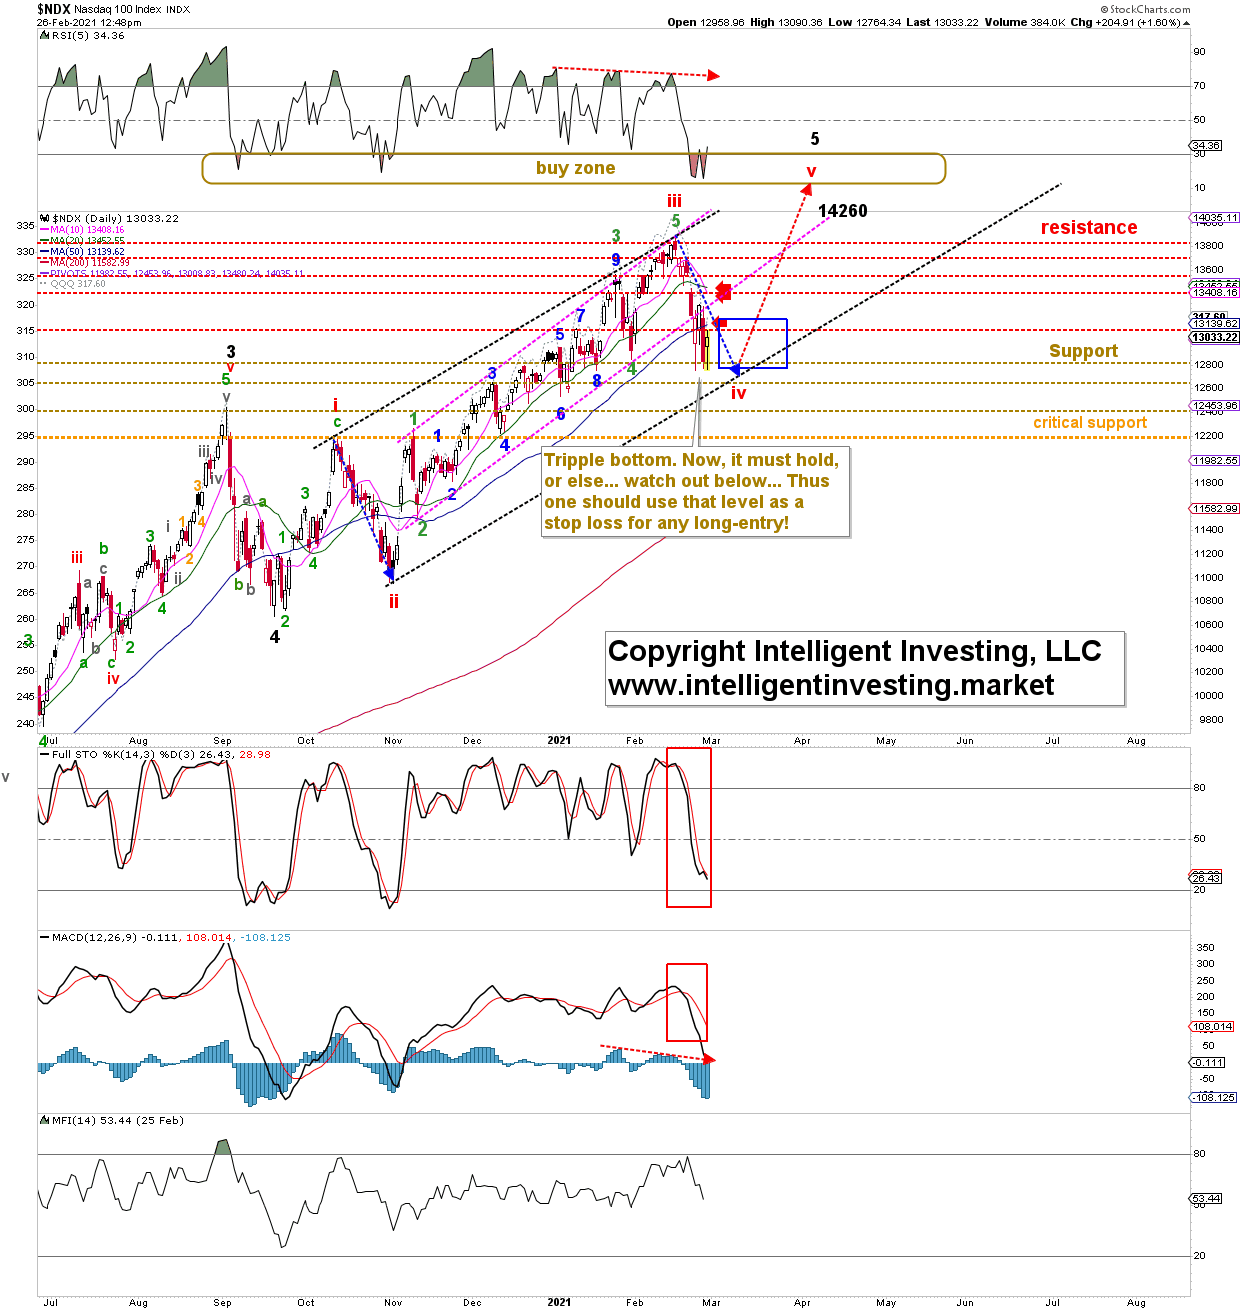
Figure 1. NDX100 daily candlestick chart with EWP count and technical indicators:
Nasdaq 100 Daily Chart.

This week, the index has bottomed three times at around 12765+/-10p. See Figure 1 above. Thus, the 12800s were reached (I was off by 0.3%, so please pardon my inaccuracy). Although the NDX can still go as low as 12710+/10 in the last few twist and turns to complete a picture-perfect wave-iv=ii relationship (blue symmetry arrows), sentiment has done enough to meet the (red) intermediate wave-iv criteria. If this week’s lows hold, on preferably a daily closing basis as that allows for an intra-day flush down to 12710, the index can now start to move higher for (red) intermediate wave-v.

Wave-v to ideally 14260+/-40 will be stepwise confirmed with

A) a daily close back above the 50-day simple moving average (SMA),

B) a daily close back above this week’s bounce higher, which in EWP-terms would be labeled as a b-wave,

C) a daily close back above the 20-d SMA.

Bottom line: This week, the NDX (finally) reached the ideal wave-iv target zone of 12800-13200, as anticipated it ideally would over the past several weeks, almost to the T. Although not necessary a last intra-day stab lower to SPX12710+/-10 within the next few days can be allowed for, and, thus, this week’s triple bottom should hold on a daily closing basis. If not, a larger flush down to 12200, based on simple symmetry, cannot be excluded. Even such a big pullback would still not invalidate the EWP count as shown, for as long as the (red) intermediate wave-i made on Oct. 12, 2020, at 12187 is not exceeded to the downside. Why? Because in an EWP standard impulse, a 4th low and 1st wave high are not allowed to overlap. If that happens, I must adjust my thinking and accept that a much larger top may already have been struck.

Latest comments

Great analysis! Thanks
Too much helicopter money in Wall Street, not making way to main street though...
im baffled as to why the market keeps setting record highs. in my US town (about 150k population) everything is falling apart. tons of businesses are closing. prices for ordinary goods & food are shooting up. massive layoffs. we have an unprecedented homeless problem & the city is making fenced in homeless camps .... no electricity or plumbing, just port-a-potties. it sure looks bad right now.
thanks for the article and charts in advance.  you've been right this whole time.  cheers and thanks for your input for the community and your followers
Many thanks for your analysis A quick question, since the DJ still has considerable room to the downside, what is you comparative analysis I fear the TECH TOP is already formed
DJ could be in something that looks like an expanding wedge or irregular correction before it escalates to the upside alongside with the ideas expressed in the article. The idea, I think, is to have either a slightly flexible or elastic approach.
Thanks for the explanation
More mumbo jumbo. EWP is another non-falsifiable technical analysis method. Nothing can disprove your assertions, because you can always go back and retroactively "prove" they were accounted for in the analysis. You might as well toss coins...
Agree, Shure is just a professional  bullXXXtter. Doctor of Craxp science.
What do you think about Apple, Dr. 🙏
love the TA. A triple bottom would be insane
Doc: look at this chart: https://invst.ly/tzljb - I checked as far back as 2000 and didn't find such a bearish pattern on NQ monthly chart.  The same chart on daily basis ( https://invst.ly/tzljt ) shows that the price is now firmly below 50 EMA and is supported by 100 EMA daily. I expect a bounce up to ~13800 levels but not above that.  I think the secular bull run is over!
Also, NQ completed TD 9 buy setup on annual (each candle 12-month bar) and monthly charts - both of these completed Dec 2020!  These are strong indicators of a huge reversal!
so does that mean stock market should go increase next week.
so does that mean stock market should go up next week.
Love your articles, keep them coming
Thank you so much for your wonderful insight.I read your articls.
I regularly read you articls. They are of high quality and insighful. Still, a bottom line is a a concise summary of the findings and normally should not be so lenghty and twisted;-)
thank you for your contribution. I love your articles
I thoroughly enjoyed your article as a workingplan for the markets as a whole. Thank you for sharing. 👍
I may add, Dr., time should prove you right and wave IV be terminated on March 15. or close.
Risk Disclosure: Trading in financial instruments and/or cryptocurrencies involves high risks including the risk of losing some, or all, of your investment amount, and may not be suitable for all investors. Prices of cryptocurrencies are extremely volatile and may be affected by external factors such as financial, regulatory or political events. Trading on margin increases the financial risks.
Before deciding to trade in financial instrument or cryptocurrencies you should be fully informed of the risks and costs associated with trading the financial markets, carefully consider your investment objectives, level of experience, and risk appetite, and seek professional advice where needed.
Fusion Media would like to remind you that the data contained in this website is not necessarily real-time nor accurate. The data and prices on the website are not necessarily provided by any market or exchange, but may be provided by market makers, and so prices may not be accurate and may differ from the actual price at any given market, meaning prices are indicative and not appropriate for trading purposes. Fusion Media and any provider of the data contained in this website will not accept liability for any loss or damage as a result of your trading, or your reliance on the information contained within this website.
It is prohibited to use, store, reproduce, display, modify, transmit or distribute the data contained in this website without the explicit prior written permission of Fusion Media and/or the data provider. All intellectual property rights are reserved by the providers and/or the exchange providing the data contained in this website.
Fusion Media may be compensated by the advertisers that appear on the website, based on your interaction with the advertisements or advertisers.
© 2007-2024 - Fusion Media Limited. All Rights Reserved.