Get 40% Off
⚠ Earnings Alert! Which stocks are poised to surge?
See the stocks on our ProPicks radar. These strategies gained 19.7% year-to-date.
Unlock full list

Is Microsoft Headed For A New Record?

Published 01/25/2021, 07:25 AM
Updated 07/09/2023, 06:31 AM

Microsoft Corp. (NASDAQ:MSFT) rallied last Wednesday to hit resistance at 226.35 on Thursday. On Friday, the share price opened with a gap above 226.35, but failed to reach the record peak of 232.86, and then, it retreated somewhat. Overall, the picture on the 4-hour chart seems to be trendless, but Friday’s break above 226.35 has confirmed a higher high and thus, we would adopt a cautiously-positive approach.

Tomorrow, the firm reports earnings for Q2 FY 2021, with expectations suggesting that EPS and revenue have risen, but at a notably slower pace than in recent years. Market participants may also focus on Azure’s revenue growth, Microsoft’s cloud platform, which is comprised of over 200 products and cloud services. Azure’s growth has been much faster than Microsoft’s but, based on the estimates for tomorrow, this has not been enough to offset the overall slowdown.

For the stock to rebound and perhaps hit once again its record high of 232.86, a positive surprise may be needed tomorrow. And if investors are strong enough to take the stock into uncharted territory, we may soon see them targeting the next psychological figure, at around 240.00.

Taking a look at our short-term oscillators, we see that the RSI exited its above-70 zone and still points to the downside, while the MACD, although above both its zero and trigger lines, shows signs of topping as well. Both indicators suggest that the strong upside speed is now easing, which means that a potential retreat may be on the cards before the next leg north, perhaps for the share price to test the 220.70 zone, marked by the inside swing high of January 8th, as a support this time.

In order to abandon the bullish case and start examining deeper declines, we would like to see a break below 212.00, marked by the lows of January 6th and 15th. This will confirm a forthcoming lower low and may initially pave the way towards the 208.00 territory, near the low of November 23rd. Another break, below 208.00, could set the stage for a larger fall, perhaps towards the low of October 30th, at 199.50.
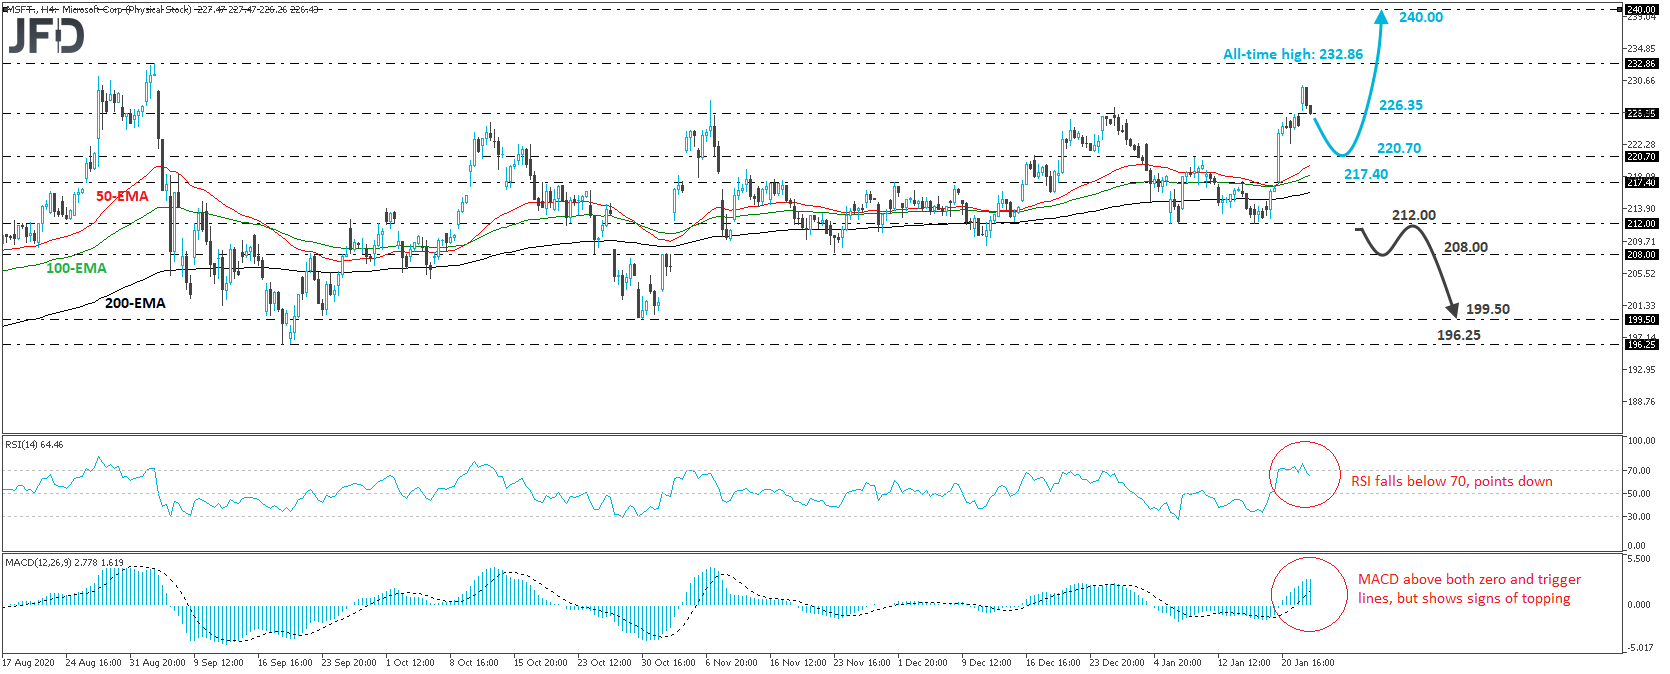
Microsoft stock 4-hour chart

Latest comments

Risk Disclosure: Trading in financial instruments and/or cryptocurrencies involves high risks including the risk of losing some, or all, of your investment amount, and may not be suitable for all investors. Prices of cryptocurrencies are extremely volatile and may be affected by external factors such as financial, regulatory or political events. Trading on margin increases the financial risks.
Before deciding to trade in financial instrument or cryptocurrencies you should be fully informed of the risks and costs associated with trading the financial markets, carefully consider your investment objectives, level of experience, and risk appetite, and seek professional advice where needed.
Fusion Media would like to remind you that the data contained in this website is not necessarily real-time nor accurate. The data and prices on the website are not necessarily provided by any market or exchange, but may be provided by market makers, and so prices may not be accurate and may differ from the actual price at any given market, meaning prices are indicative and not appropriate for trading purposes. Fusion Media and any provider of the data contained in this website will not accept liability for any loss or damage as a result of your trading, or your reliance on the information contained within this website.
It is prohibited to use, store, reproduce, display, modify, transmit or distribute the data contained in this website without the explicit prior written permission of Fusion Media and/or the data provider. All intellectual property rights are reserved by the providers and/or the exchange providing the data contained in this website.
Fusion Media may be compensated by the advertisers that appear on the website, based on your interaction with the advertisements or advertisers.
© 2007-2024 - Fusion Media Limited. All Rights Reserved.