DAILY CHART
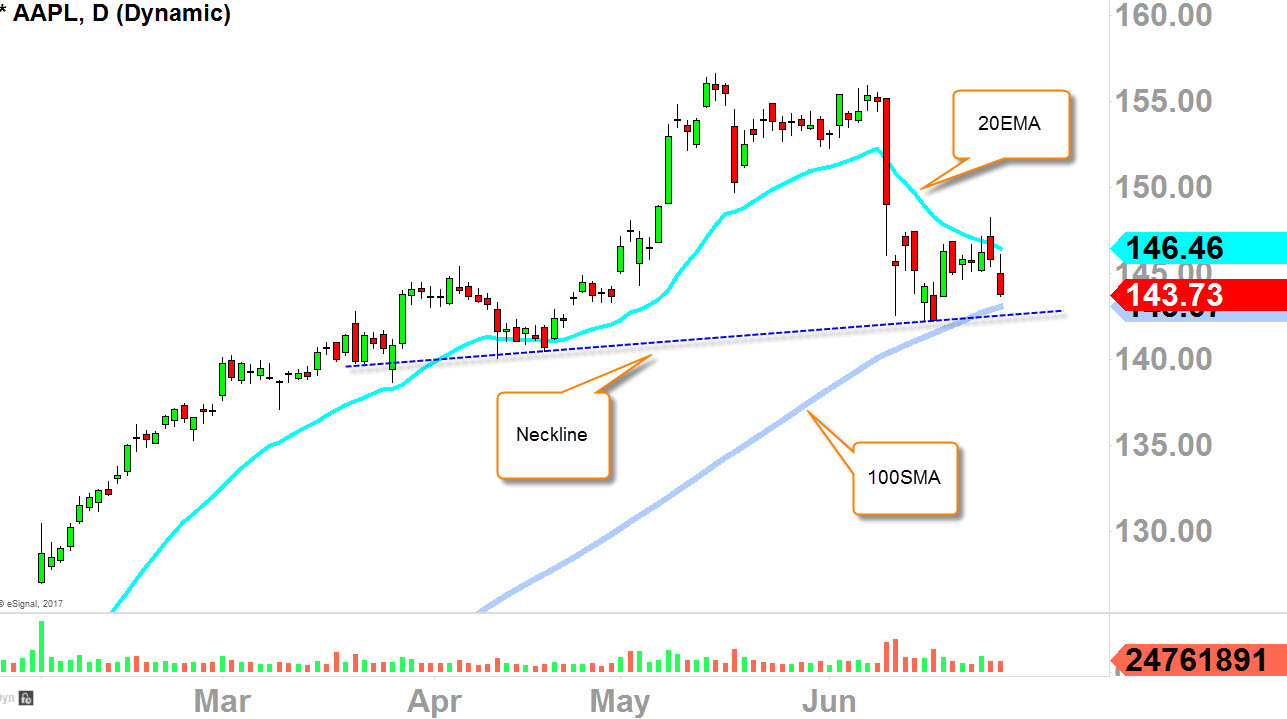
Here are the three technical levels you need to watch for the minor-term sentiment.
- 20EMA
- Neckline
- 100SMA
This is the first time since the late-December that "20EMA" is acting as resistance and curling down, while the rising "100SMA," which has a impressive resume as it acted as a major support back in 11/14/2016 (one of the main reasons of why I was buying more CALLS at the time) and 12/05/2016, is now near the current price at 143-142ish.
This 100SMA, 142-143ish is a very important level for AAPL in the intermediate term because this level is also coinciding with the "Neckline" pivot (remember, when the technicals coincide like this, you pay attention to that level).
For the minor-term sentiment to change back to bullish, we would need to see the price well-above "20EMA," but to be safe, above 149 to fully nullify this selling pressure/fear.
However, if we lose "100SMA" and "Neckline" to the downside (if price starts to fall below 140ish, things could get very hectic for the buyers because we simply don't have any well-defined support below.
It's because Apple Inc (NASDAQ:AAPL) pretty much went straight up since the Earnings gap back in 2/1/2017.
So the battle ground will be "100SMA" and "Neckline" area where we could see volatility where bulls would want to protect that level while bears will try to flush it through.

WEEKLY CHART
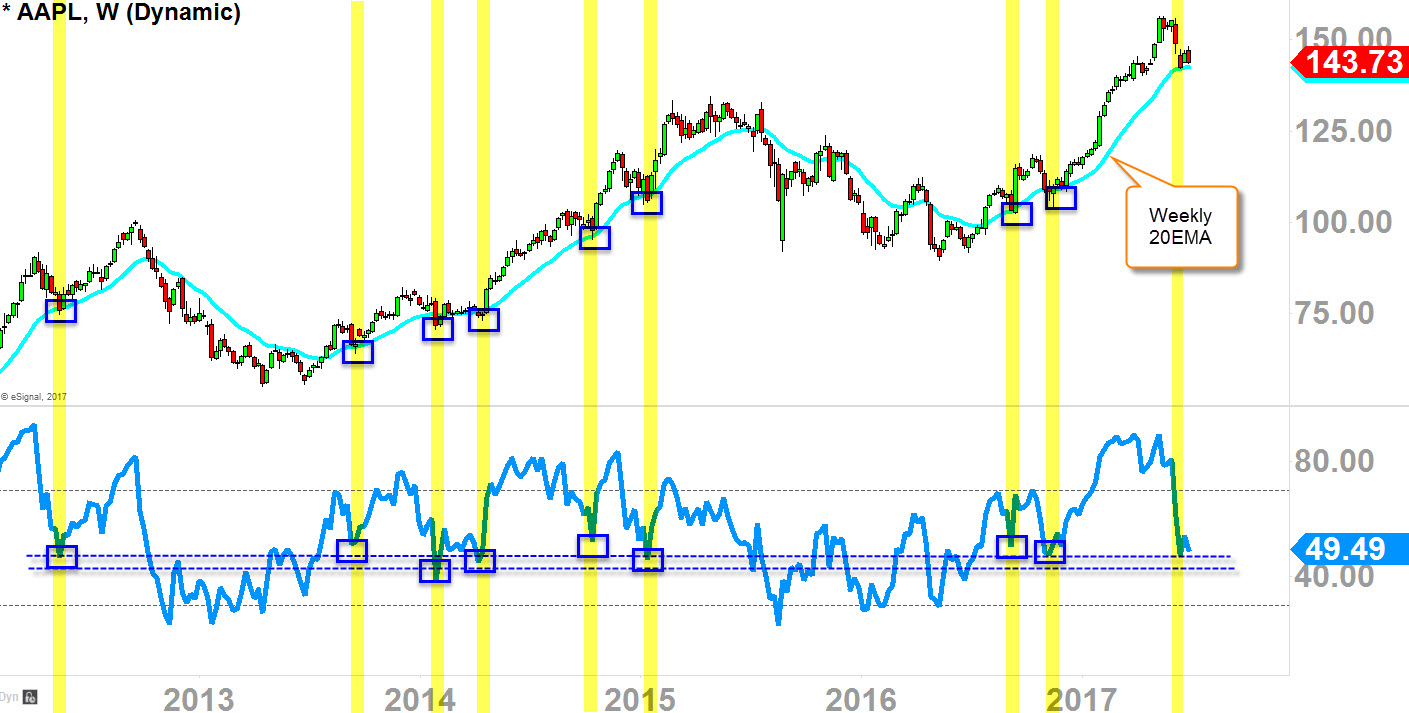
Here are the three technical levels you need to watch for the intermediate-term sentiment.
- Weekly 20EMA
- Weekly RSI
On my previous analysis, I talked about this level of "Weekly 20EMA;" well, here we are at the rising "Weekly 20EMA" while retesting my oscillator (RSI) middle level of the band.
This middle-level band is very important as you can see on this weekly historical chart.
This level is a crucial level for bulls to defend for the uptrend to resume higher, again, because it has been very important level in the life of AAPL as it continued higher to the upside as long as we held this level (see blue circles in price-action).
However, things turned pretty ugly when we lose this level of "Weekly 20EMA" as you can see in the chart below.
So with RSI at the middle level and pricing is retesting "Weekly 20EMA," stage is set for the show down for both bulls and bears to bring out their best to either protect the level or to defeat the level.
If bears do win and flushes it through, I think my oscillator will get back down all the day to the bottom of the band and the price might get to 133ish level which is prior peak from July of 2015 as this is the only strong support we have on this chart if we lose this current support of "Weekly 20EMA."

MONTHLY CHART
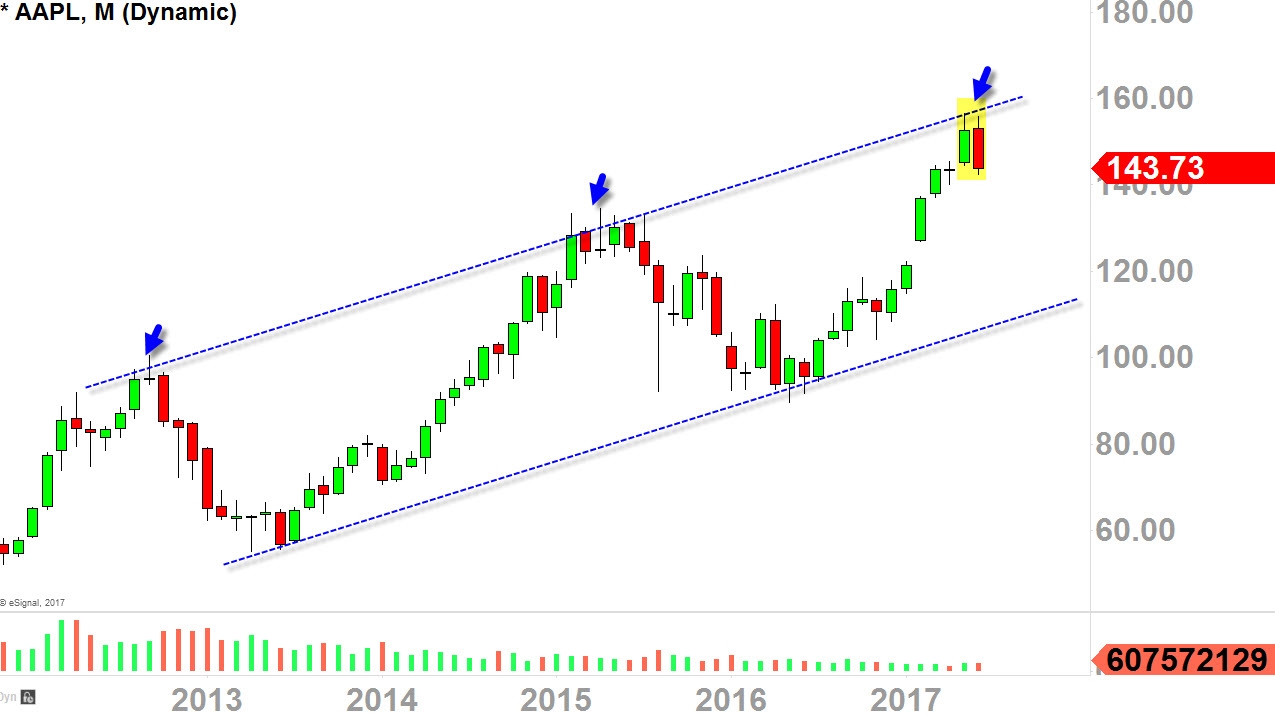
Here are the two technicals you need to watch for the primary-term sentiment.
- Channel resistance
- Engulfing candle
I was highly skeptical with the recent move on AAPL as it was nearing this monthly channel resistance as I've tweeted out few weeks ago.
We have three more days before this candle solidifies (end of June), but currently we are seeing an engulfing monthly candle.
Yes, it's a bearish candle formation but I don't believe this is strong enough to crash AAPL like late 2012 and late 2015--we would need more evidence for that, but for now, not enough to support CRASH talk yet.
Currently this candle is completely engulfing last month's candle, so this signal is weighting little bit more on to the bearish side.
Like I've pointed out Daily Chart and Weekly Chart levels on this post, if those levels break to the downside, this monthly chart will start to really weigh in to support bearish connotation
DISCLAIMER: I have no positions on AAPL at the time of this article

