Social app-based gaming publisher Glu Mobile (NASDAQ:GLUU) stock has been a pandemic winner as homebound consumers flocked to its addictive portfolio of free-to-play mobile games. The fear that users would dissipate as a return to normal trend accelerates may have been overdone. Analysts may have underestimated the stickiness of the Company’s titles as the role of mobile games are embedded in the new normal.
Unlike console gaming where users have to play at home where their Sony (NYSE:SNE) PlayStation or Microsoft (NASDAQ:MSFT) Xbox or gaming rig is located, mobile gaming is all about the convenience of access and simplicity of the product. A game is just a tap (and a few seconds) away on the smartphone from anywhere, anytime and for any duration of time. The casual convenience enables Glu to target a much larger demographic of consumers. The advent of 5G will only make these titles even more sticky as new titles and legacy titles continue to grow engagements. Prudent investors seeking a piece of the new normal as markets reprice mobile gaming stocks can watch shares of Glu Mobile for opportunistic pullback entries.
Q3 FY 2020 Earnings Release
On Nov. 5, 2020, Glu Mobile released its fiscal third-quarter 2020 results for the quarter ending September 2020. The Company reported an earnings-per-share (EPS) profits of $0.08 beating analyst estimates by $0.02 versus a loss of (-$0.03) in Q3 2019. Revenues rose 48% year-over-year (YoY) to $158.5 with net income of $13.4 million. Bookings rose 22% YoY with a 13% increase in Growth Games. The Company generated $31.5 million in free cash flow ending the quarter with $318.1 million in cash to support its acquisition strategy. The Company raised its full-year 2020 bookings to a range of $555.3 to $560.3 million and expected “significantly higher” bottom line results in 2020. The Company rolled out Table & Taste, a lifestyle food and décor based game. The core business was driven by Crowdstar Studios and Glu Sports brands.
Conference Call Takeaways
Glu Mobile CEO, Nick Earl, raised full-year guidance:
“We entered 2020 with bookings guidance of $428 million or 1% year-over-year growth. In this year’s first nine months, we’ve surpassed that with $435.8 million in bookings and today raise guidance to $558.3 million at the midpoint representing 32% annual growth.”
He went on to underscore the new normal:
“We believe we are in the early stages of realizing the scale that we have spoken about as our bookings grow.”
He noted bookings for the Company’s three growth games rose 13% YoY which include Design home, Covet fashion and Kim Kardashian Hollywood seeing 170% YoY becoming a 2021 growth game. The growth games contributed 71% of total bookings. Covet fashion grew revenues 30% YoY to $22.4 million, Design home grew 15% YoY to $52.1 million and Disney Sorcerer’s Arena had $14.7 million in bookings. Kim Kardashian Hollywood bookings grew 171% YoY to $12.4 million.
Goldman Downgrade
On Jan. 25, 2021, Goldman Sachs (NYSE:GS) downgraded shares of Glu Mobile to Neutral from Buy with a new target price of $10.40. The justification is the outperformance of its shares at the time year-to-date(YTD) performance was 13% versus the S&P 500 at 8%. They expect the company to underperform it’s 2021 estimates and feels stay-at-home was responsible for its performance in 2020, which should slide in 2021. This caused shares to sink temporarily to lows of $8.77 before basing in 2021. Once again, analysts may be underestimating the stickiness of mobile gaming as a real component of the new normal. Prudent investors that believe this premise can watch for opportunistic pullbacks in shares of Glu Mobile.

GLUU Opportunistic Pullback Levels
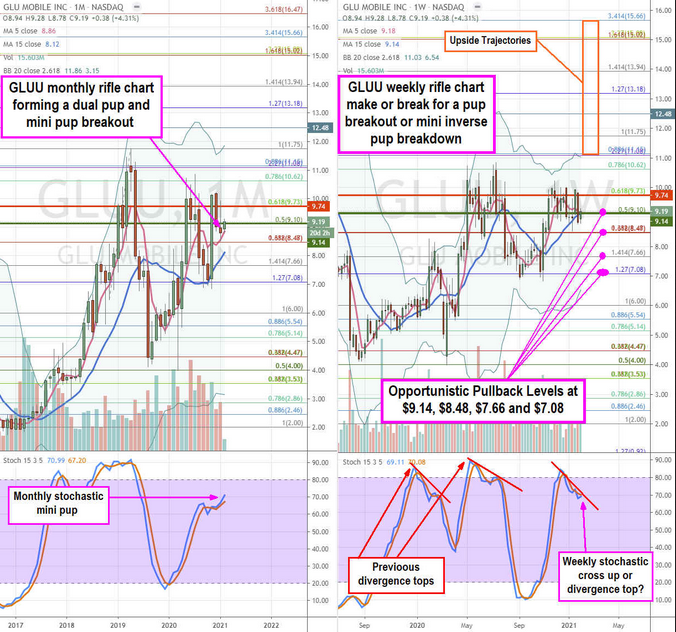
Using the rifle charts on the monthly and weekly time frames provides a broader view of the playing field for GLUU shares. The monthly rifle chart has a double-barrel pup breakout composed of a moving average (MA) pup breakout and a stochastic mini pup. The 5-period MA is just above the $8.48 Fibonacci (fib) level. The monthly upper Bollinger Bands (BBs) sit at $11.86. The weekly rifle chart is in a make or break as the weekly 5-period MA continues to slope lower at $9.18. The weekly stochastic will determine the make or break by either crossing up or failing and forming the mini inverse pup. The daily market structure low (MSL) buy triggers above $9.14 but collides with a market structure high (MSH) sell trigger below $9.74. The prior two stochastic divergence tops resulted in an oscillation down sell-off, but the monthly rifle chart is pushing for a breakout. Prudent investors can look for opportunistic pullback levels at the $9.14 daily MSL trigger, $8.48 fib, $7.66 fib, fib, and the $7.08 fib. The upside trajectories range from the $11.08 fib up towards the $15.66 fib level. It’s prudent to watch shares of competitor Zynga (NASDAQ:ZNGA)) as the other key player in this industry.
