Get 40% Off
⚠ Earnings Alert! Which stocks are poised to surge?
See the stocks on our ProPicks radar. These strategies gained 19.7% year-to-date.
Unlock full list

Is Gold Ready To Break $1,300?

Published 06/26/2017, 12:12 AM
Updated 07/09/2023, 06:31 AM

Over the last couple of weeks, I've been writing that metals would be turning the corner higher after the Fed. This past week we did move higher in metals and miners.

This should continue but there are still some bumps in the road unless we get gold over $1260 and silver over $16.80, preferably $17. We have gold up 1.80 to 1257.10 and silver up 2 cents to 16.70 now in early Asian trading. Until we break those marks we could still see one more trip lower, but it will be because the dollar and USD/JPY have one more trip higher, so still watch those.

We can’t let the USD/JPY get back over 111.78. A break of 111.50 and it looks like it might. On the downside we need to first break 111.15.
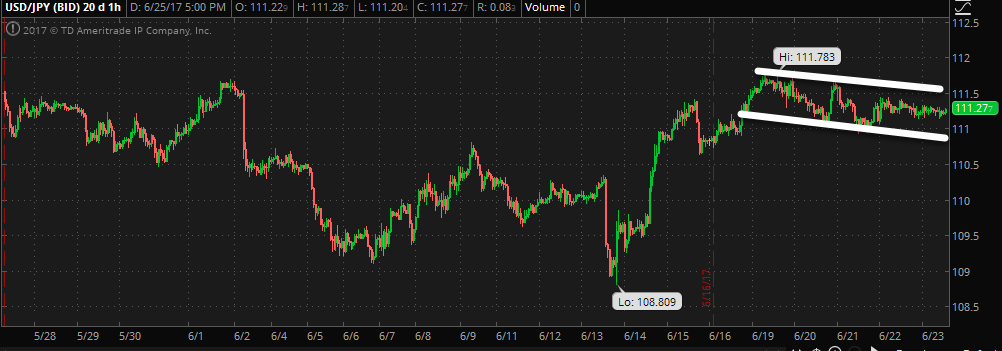
USD/JPY 60-Minute Chart

You can see in the chart below exactly where we are, zooming out a couple months. That’s why a tick over 1260 and the move higher to 1300 should kick in.

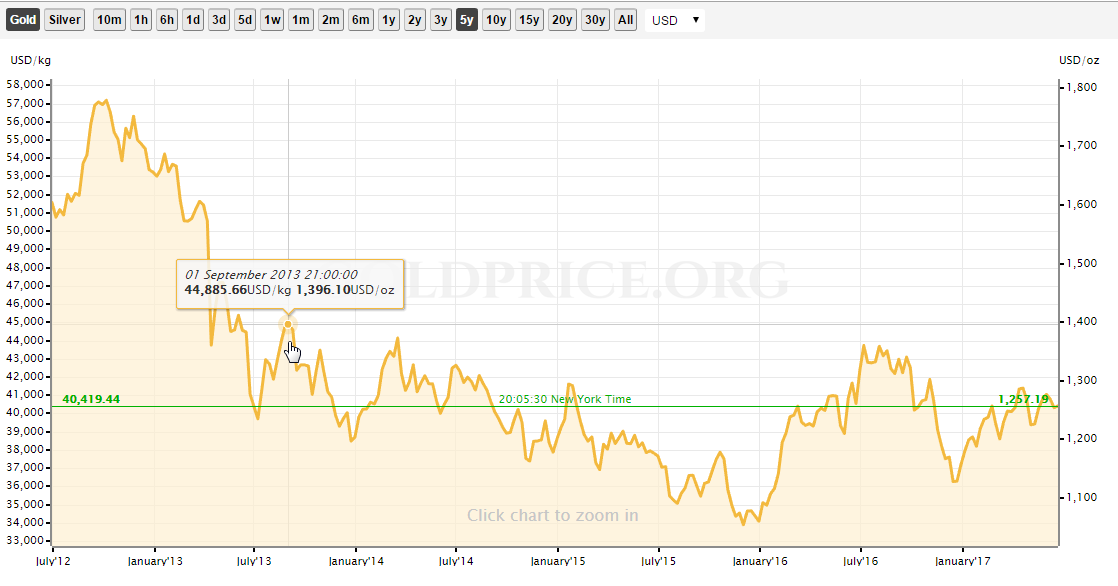
We’ll determine if $1400 is within reach soon enough. Look at that nice 5-year chart though and you can see an opportunity knocking to lock in some gold bulls who think we’ll just head back up to over $1900 again in what we’ll call another gold bull trap (that’s what I would do if I was capable of doing so as a market maker).

But that’s when what I have written about in a deflationary credit contraction will kick in. That’s when I’ll be saying; watch out below. I know it’s difficult for some of you to imagine this, but those of you who have followed me a long time, know I call the ups and downs pretty well and the reason I wrote my book is to help investors see what I see.

I present the data and you decide. Simple as that as an informed investor makes good decisions.
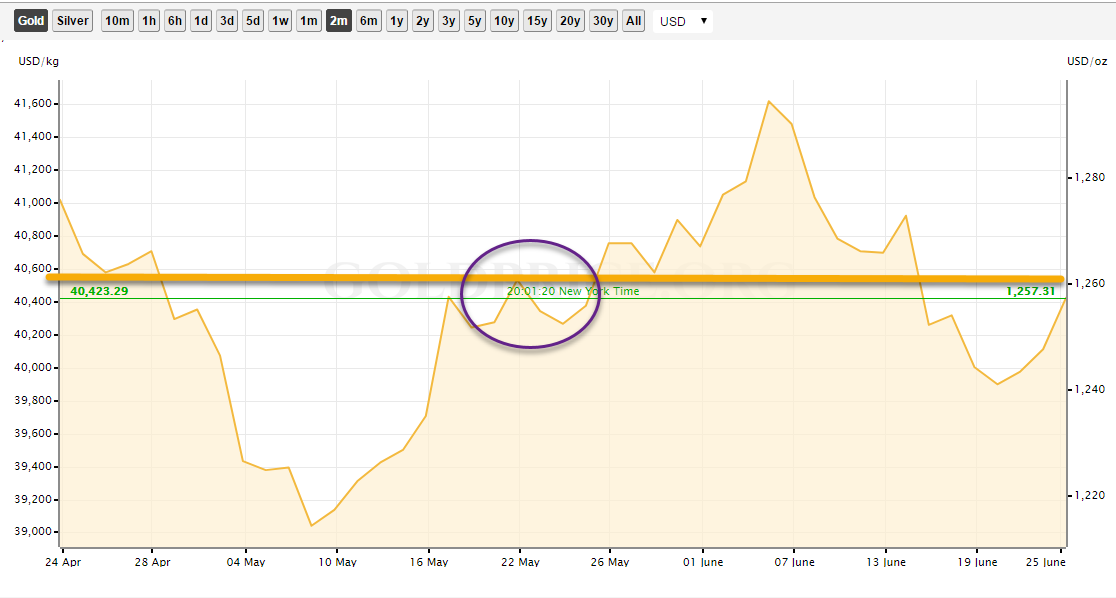
Gold Chart

Gold 5-Y Price Chart

Latest comments

Useless
USD/JPY correlation to gold useless? lol. . We make money up or down with JNUG and JDST and if you bothered to pull up a chart, you would see the correlation.
Risk Disclosure: Trading in financial instruments and/or cryptocurrencies involves high risks including the risk of losing some, or all, of your investment amount, and may not be suitable for all investors. Prices of cryptocurrencies are extremely volatile and may be affected by external factors such as financial, regulatory or political events. Trading on margin increases the financial risks.
Before deciding to trade in financial instrument or cryptocurrencies you should be fully informed of the risks and costs associated with trading the financial markets, carefully consider your investment objectives, level of experience, and risk appetite, and seek professional advice where needed.
Fusion Media would like to remind you that the data contained in this website is not necessarily real-time nor accurate. The data and prices on the website are not necessarily provided by any market or exchange, but may be provided by market makers, and so prices may not be accurate and may differ from the actual price at any given market, meaning prices are indicative and not appropriate for trading purposes. Fusion Media and any provider of the data contained in this website will not accept liability for any loss or damage as a result of your trading, or your reliance on the information contained within this website.
It is prohibited to use, store, reproduce, display, modify, transmit or distribute the data contained in this website without the explicit prior written permission of Fusion Media and/or the data provider. All intellectual property rights are reserved by the providers and/or the exchange providing the data contained in this website.
Fusion Media may be compensated by the advertisers that appear on the website, based on your interaction with the advertisements or advertisers.
© 2007-2024 - Fusion Media Limited. All Rights Reserved.