Get 40% Off
🚨 Volatile Markets? Find Hidden Gems for Serious OutperformanceFind Stocks Now

Is EUR/USD Poised To Trade Further North?

Published 04/12/2021, 07:26 AM
Updated 07/09/2023, 06:31 AM

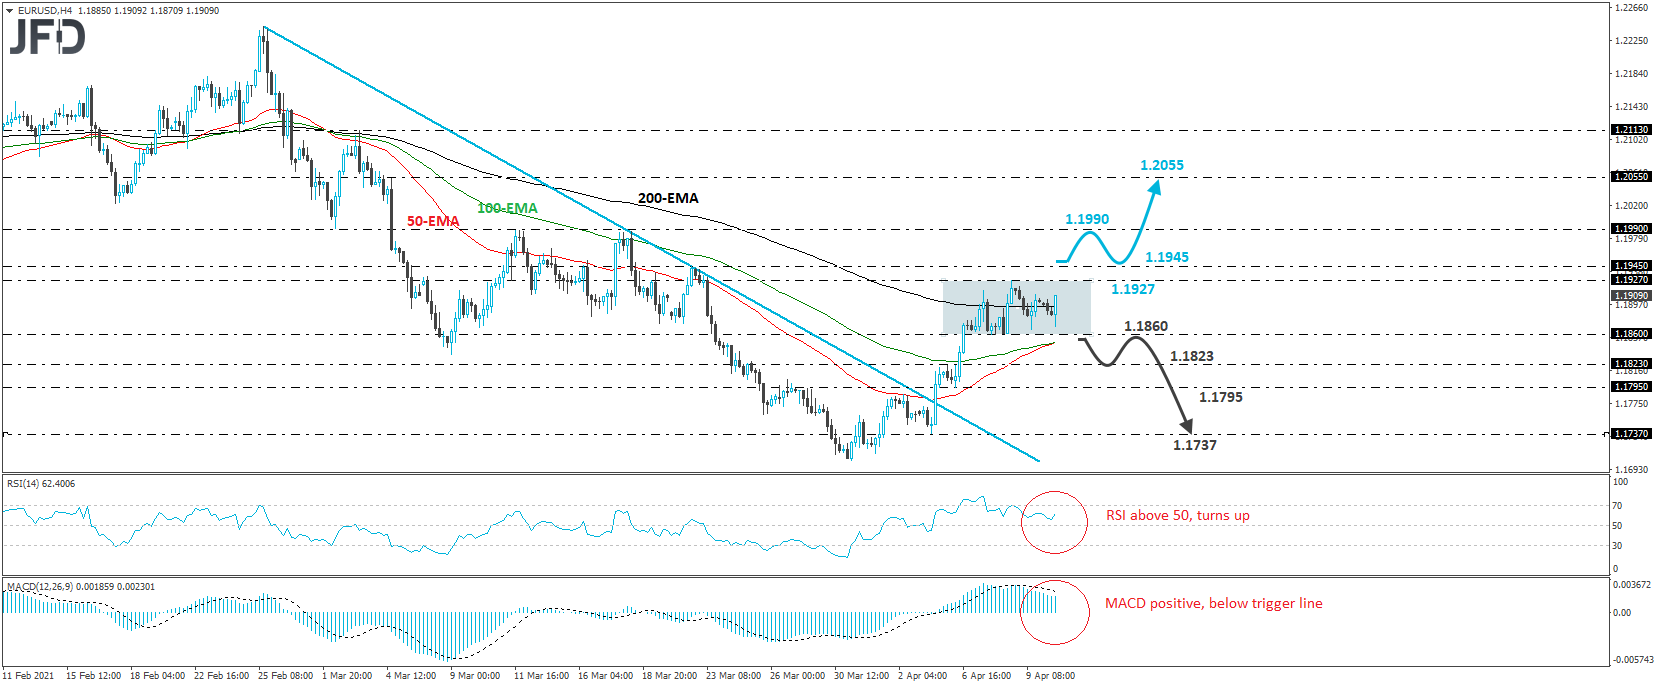
EUR/USD has been trading in a small sideways range since last Tuesday, between the 1.1860 support and the 1.1927 resistance. Although this keeps the very short-term bias neutral, the fact that the rate continues to trade above the prior downside resistance line drawn from the high of Feb. 25, makes us believe that there are more chances for the rate to break the range through its upper boundary, rather than its lower. Thus, we will adopt a cautiously positive stance for now.

A break above the upper end of the range, at 1.1927, or even better, above 1.1945, which is the high of Mar. 22, may encourage the bulls to drive the battle higher, towards the 1.1990 zone, which provided strong resistance on Mar. 11 and 18. That barrier was also seen as a support back on Mar. 2. If that zone is not able to stop the bulls this time around, its break may set the stage for extensions towards the 1.2055 hurdle, marked as a resistance by an intraday swing high formed on Mar. 4.

Shifting attention to our short-term oscillators, we see that the RSI lies above 50 and has recently turned up again. The MACD, although below its trigger line, runs within its positive zone and shows signs that it could also turn up soon. Both indicators suggest that the rate may start picking up positive momentum soon, which adds more credence to our view that the pair is more likely to exit its recent range through its upper bound.

3rd party Ad. Not an offer or recommendation by Investing.com. See disclosure here or remove ads .

Now, in case the bears take charge and push the action below the range’s lower end, at 1.1860, we may see them initially aiming for the high of Apr. 5, at 1.1823, or the low of the day after, at around 1.1795. If neither barrier is strong enough to stop the decline, then we may experience extensions towards the low of Apr. 5, at around 1.1737.
EUR/USD 4-hour chart technical analysis

Latest comments

Risk Disclosure: Trading in financial instruments and/or cryptocurrencies involves high risks including the risk of losing some, or all, of your investment amount, and may not be suitable for all investors. Prices of cryptocurrencies are extremely volatile and may be affected by external factors such as financial, regulatory or political events. Trading on margin increases the financial risks.
Before deciding to trade in financial instrument or cryptocurrencies you should be fully informed of the risks and costs associated with trading the financial markets, carefully consider your investment objectives, level of experience, and risk appetite, and seek professional advice where needed.
Fusion Media would like to remind you that the data contained in this website is not necessarily real-time nor accurate. The data and prices on the website are not necessarily provided by any market or exchange, but may be provided by market makers, and so prices may not be accurate and may differ from the actual price at any given market, meaning prices are indicative and not appropriate for trading purposes. Fusion Media and any provider of the data contained in this website will not accept liability for any loss or damage as a result of your trading, or your reliance on the information contained within this website.
It is prohibited to use, store, reproduce, display, modify, transmit or distribute the data contained in this website without the explicit prior written permission of Fusion Media and/or the data provider. All intellectual property rights are reserved by the providers and/or the exchange providing the data contained in this website.
Fusion Media may be compensated by the advertisers that appear on the website, based on your interaction with the advertisements or advertisers.
© 2007-2024 - Fusion Media Limited. All Rights Reserved.