Get 40% Off
🚨 Volatile Markets? Find Hidden Gems for Serious OutperformanceFind Stocks Now

Is Bitcoin Getting A 30-50% Haircut?

Published 02/23/2021, 02:21 PM
Updated 07/09/2023, 06:31 AM

For those who follow me here, you know I have mostly been right on the money when it comes to forecasting where Bitcoin would top and bottom using the Elliott Wave Principle (EWP) combined with technical analysis. A quick trip down memory lane: This is what I had forecasted on Jan. 11:

I prefer this [red intermediate] wave-iv to bottom at around $29K +/-1K over the next one to two weeks before wave-v to new all-time highs kicks in. It is most likely to be around $50-60K to complete an even larger 3rd wave (major-3). Then, the next 4th wave (major-4) should occur, etc. I do not view the rally since 2018 complete until we see at least two more, even larger rallies, from that major-4 low with six-digit upside targets.”

Bitcoin bottomed Jan. 22 at $28,817 for intermediate wave-iv and topped Feb. 21 at $58,445 for most likely, major wave-3, and major wave-4 is now under way. You can read my previous and subsequent article to ascertain that EWP and technical analysis combined. It is one of the most accurate and reliable ways to forecast financial assets, like Bitcoin, that one can use to bank on.

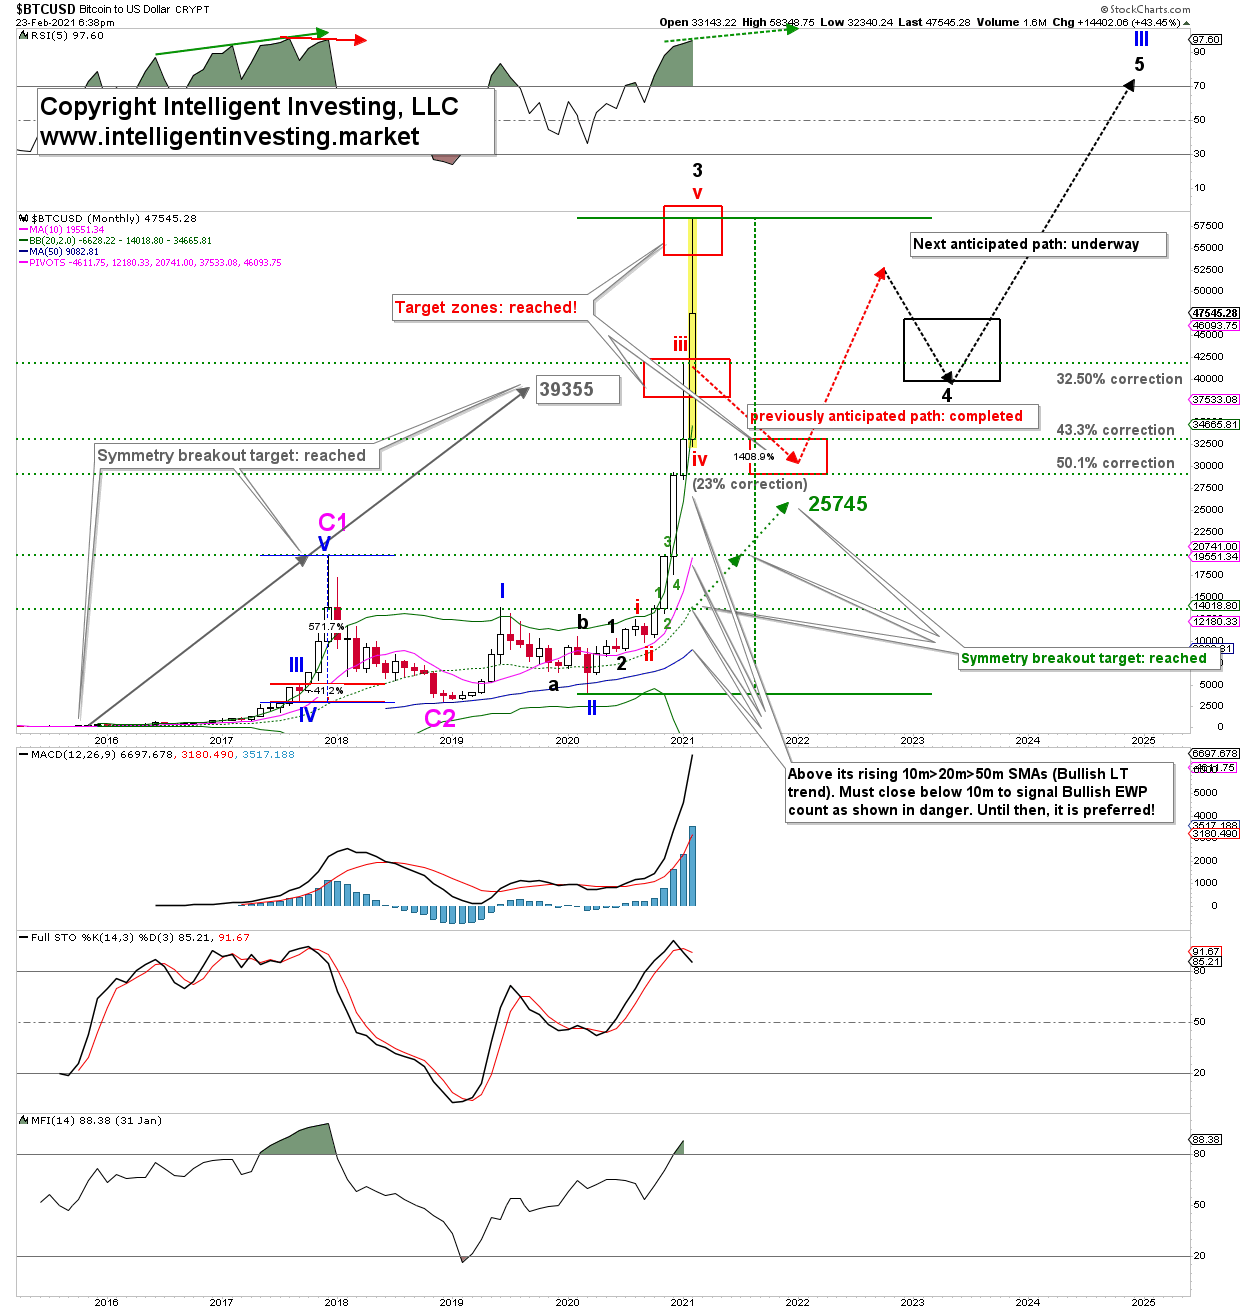
In the short-term, Bitcoin still can rally one more time to the low $60,000s, I would like to focus on the bigger picture using the monthly chart. See Figure 1 below.

As you can see, BTC reached each of my Fibonacci- and EWP-based target zones, which I have shared with you, for (red) wave-iii, iv, and v. It followed the anticipated (red) path well. Now, I expect the black trail to unfold. Although I am always wrong till proven right by Mr. Market, given that the anticipated initial targets were hit, I must assume the black path will be correct.

3rd party Ad. Not an offer or recommendation by Investing.com. See disclosure here or remove ads .

Figure 1. Monthly Bitcoin candlestick chart, with EWP count and technical indicators:
Bitcoin Monthly Chart With EWP Count.

But let us first go back to 2017 as we can always learn from past patterns. In September 2017, BTC corrected over 40% for a (blue) Primary-IV wave and then rallied 570% (!) for a Primary-V wave before topping out for a Cycle-1 wave. There was no negative divergence on the RSI5 indicator (solid green arrow) until later in the year (solid red arrow). The latter foretold a pending, large correction, as this is on the monthly timeframe. Besides, the price was above its rising 10-month Simple Moving Average (10m SMA), which, in turn, was above the rising 20m and 50m SMAs. Thus, we can learn that 4th waves can correct severely, but that the 5th wave will make up for it, and then some.

The current wave-degree is, in my opinion, similar. And at this moment, there is no negative divergence on the monthly RSI5 (dotted green arrow), while the price is above its rising 10m>20m>50m. Thus, the chart setup is similar between fall of 2017 and now: strongly suggesting more upside ahead.

Moreover, I have annotated in the above chart how much BTC will correct to reach the lower end of the ideal (black) major wave-4 target zone (32.5%: $41750), and the two next horizontal support levels (43.3%: $33,050, 50.1%: $29,045, respectively). The 1st two levels fit well with the 2017 analog. Extrapolating the subsequent gains from 2017 to now, major-5 can rally to as high as $165,555-237,975 (!), depending on where exactly wave-4 will bottom. Please remember, BTC has already rallied over 1400% since its March 2020 low. Thus, another few hundred percentage points are not out of the ordinary.

3rd party Ad. Not an offer or recommendation by Investing.com. See disclosure here or remove ads .

Given that BTC is in its most substantial part of its rally: Primary-III of Cycle-3, I expect the correction to be preferably on the shallow side because in bull markets, the downside disappoints and upside surprises. The 2017 analog proves this point.

Bottom line: My forecasts for BTC have been correct over the last several months, and I now anticipate its most extensive haircut since the rally in March 2020 started. Ideally, it will go to around $32,000-$42,000. From there, I expect the next multi-month rally, which could carry BTC into the six digits.

Latest comments

Where is the hair cutter? 🤔
Any followup on this?
@Dr.Arnout, it did fall about 25% last week and rallied, do you still think 30%+ hair cut is still in the cards for BTC?
Any reason while the Market indices and Bitcoin should follow one another, or is it just an overall trade of sentiment? Thank you for yet another interesting article, by the way.
With the current trends, is it advisable to invest in Bitcoin now or Altcoins?
Now it is just a number. Exxon has been tracking the same sort of gains recently, as this Bitfraud, yet you get a dividend and annual reports. These are not currencies, they are just a market of unregulated securities. Good gambling to any who have profited in such a ruthless market. Congrats. But “investors” usually get smoked by traders, so watch put, and trade to real money when you can, or you will lose all, when the markets mo e on.
Since article was just after 2pm and the drop was not to 42k to 29k range, is this jump to 50k Tuesday night a bull trap with reversal down to that range Wednesday then strong reversal up to low 60Ks if I followed you correctly?
not sure I follow your chart... is the X axis years? So you don’t think it’ll get above 60K until 2025? what month and year do you think it’ll be above six digits?
The black dotted up arrow is just a projection that fits within the space of the chart: not accurate in time!
Time to switch to dogecoin
Wow! I will give credit where it's due, you have been right on the money since I've started reading your articles. Also, the one about a 5-10% correction on the NDX is, at the moment, exactly right. As for this article, are you saying you think a pullback to 42K is the preferable shallow pullback?
Thank you. Let's see how long I can keep up this winning streak before the market punches me out ;-) A shallow pullback to 32-42 preferred. Not enough data to know exactly how low.
 Ha! no kidding. The markets have one *****of a sneak attack upper-cut. I was hoping the pull back wouldn't be that deep, but it will do what it does.
What was that drop, the first or the second one last night or the totally drop? 15%? It wasn’t so lazy , I would stick it on the chart and look at the Fibonacci’s
still part of the larger correction IMHO.
Risk Disclosure: Trading in financial instruments and/or cryptocurrencies involves high risks including the risk of losing some, or all, of your investment amount, and may not be suitable for all investors. Prices of cryptocurrencies are extremely volatile and may be affected by external factors such as financial, regulatory or political events. Trading on margin increases the financial risks.
Before deciding to trade in financial instrument or cryptocurrencies you should be fully informed of the risks and costs associated with trading the financial markets, carefully consider your investment objectives, level of experience, and risk appetite, and seek professional advice where needed.
Fusion Media would like to remind you that the data contained in this website is not necessarily real-time nor accurate. The data and prices on the website are not necessarily provided by any market or exchange, but may be provided by market makers, and so prices may not be accurate and may differ from the actual price at any given market, meaning prices are indicative and not appropriate for trading purposes. Fusion Media and any provider of the data contained in this website will not accept liability for any loss or damage as a result of your trading, or your reliance on the information contained within this website.
It is prohibited to use, store, reproduce, display, modify, transmit or distribute the data contained in this website without the explicit prior written permission of Fusion Media and/or the data provider. All intellectual property rights are reserved by the providers and/or the exchange providing the data contained in this website.
Fusion Media may be compensated by the advertisers that appear on the website, based on your interaction with the advertisements or advertisers.
© 2007-2024 - Fusion Media Limited. All Rights Reserved.