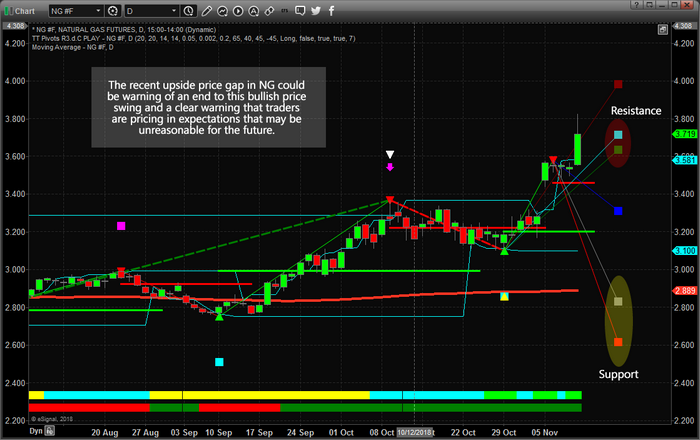
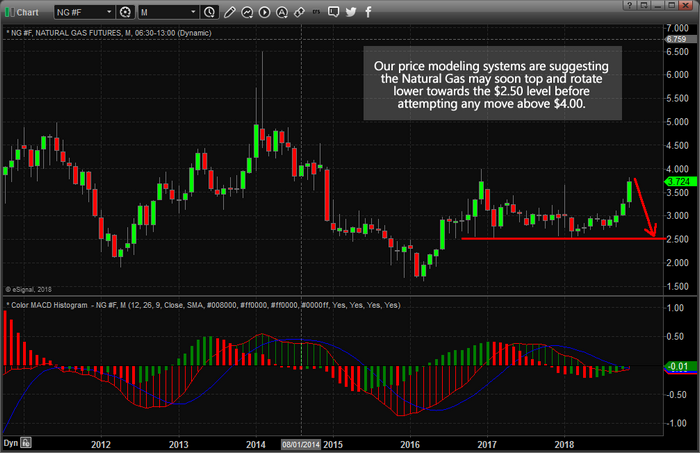
The recent upswing in NG prices has been an incredible trade for many, yet we believe a top is now forming in Natural Gas that could catch many traders by surprise. The recent upside gap in price and upward price volatility would normally not concern long traders. They would likely view this as a tremendous success for their long NG positions, yet we believe this move is about to come to a dramatic end – fairly quickly.
Our predictive price modeling systems are suggesting that Natural Gas may be setting up a topping pattern on weakness near our Fibonacci price target levels. As you can see from this Daily NG chart, the upside price gap recently has prompted a big upside price move that ended near our Fibonacci price target levels marked as “Resistance” on the right side of this chart. Normally, when the price reaches these levels, or near these levels, we expect price resistance to become a dominant factor. Additionally, we need to highlight the potential for the higher Fibonacci target, near $4.00-4.15, to be reached on an extended move higher. If this were to happen, we believe price would be strongly overextended and would likely rotate lower towards the $3.20 level rather quickly.
Support can be found near $2.60 to $2.80 on this chart and we believe the new highs, near $3.80, will likely extend the Fibonacci support targets a bit lower as price rotates to form the top pattern we are expecting.

It is a bit too early to actually “call a top” in Natural Gas at the moment, but we believe we are very near to setting up and forming a top reversal pattern in NG and are alerting our followers and members to this setup before it happens. We believe a price top will continue to setup over the next week or so before a new downward price trend pushes prices back towards the $2.50 level where support will likely hold.

Historically, the month of November has shown a moderately positive outcome over the past 25 years (resulting in a +0.59 average upside bias with a nearly 52% probability ratio). As of right now, NG is +0.46 for the November 2018 – indicating very limited upside range still exists.
For the month of December, NG historically results in a negative outcome (resulting in a -$2.61 average downside price bias with a nearly 60% probability ratio). For the month of January, NG has shown a decidedly negative price outcome (resulting in a -$6.69 average downside price bias with a nearly 71% probability ratio). Obviously, assuming these 25-year price studies are correct and their probability factors continue to be accurate, the upside move in Natural Gas may be very near a top and traders need to be aware of the potential for a quick and dramatic price trend reversal.
