Consumer Confidence at 125...are you kidding me?
The Conference Board's Consumer Confidence index for the month of March was reported on Tuesday to be 125.6! If I recall, this index bottomed out near 20 as the stock market was making what we now know as a generational low in 2009. I started to type that the March reading was the highest I've ever seen, before noticing that it printed a 128.6 at the end of 2000. In all fairness, I was a clueless college student in 2000 so even if it happened, I probably didn't actually see it.
The premise behind this index is that consumers are feeling emboldened by a positive view of business, labor market conditions, and the overall economy. On a side note, the survey responsible for this index was taken before the failure of the health care reform bill. Nevertheless, it is clear that consumers are feeling good and as a result, they are putting money to work in the stock market.
If you look at a long-term chart of the Consumer Confidence index, it almost identically coincides with the direction of the stock market. With this in mind, there could be some red flags waving. In the past, we've seen major tops and bottoms in the stock market at times in which the Consumer Confidence index is at extreme highs and lows, respectively. Particularly readings in excess of 100.
For instance, the last time the Consumer Confidence was this high in 2000, the S&P peaked dropping 50% over the next two years. Likewise, the Consumer Confidence was near 110 in 2007 just before the S&P fell 60% in the subsequent two years. Since the election, we've seen the Consumer Confidence index breach and hold above 100 for the first time since 2007 (and prior to that the early 2000s). Will this time be different?
*It is only fair to note that the Consumer Confidence hovered above 100 in the mid-2000s for quite some time before the stock market rolled over and during that time stocks rallied nicely (until they didn't).
Treasury Futures Markets
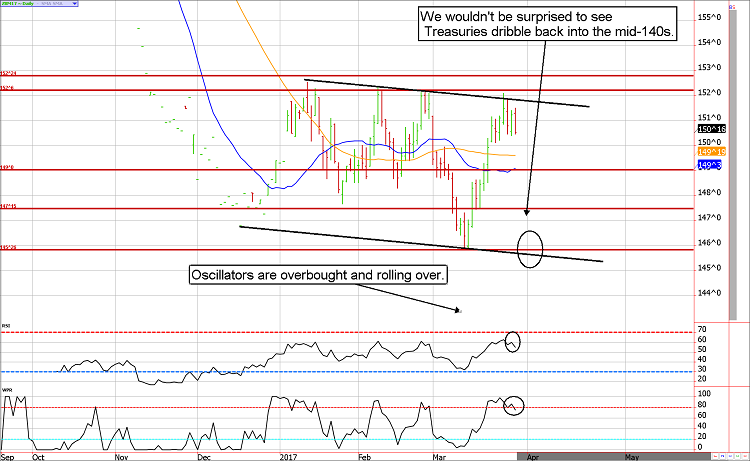
With resistance holding, we don't see any reason to be bullish bonds in the short-run
We'll keep it short. Despite what seems to be an overcrowded short trade in the Treasury market, it seems as though the masses will get their way for the time being. Seasonals are bullish in equities, which should lead stocks higher and bonds lower in the coming week or so. In fact, if the ES tests the 2405 area as expected, we could see the 30-year bond decline into the 145/146 area.
Treasury Futures Market Analysis
**Bond Futures Market Consensus:** It feels like the rally as rolled over. We could see another trip back to the mid-140s in Treasuries.
**Technical Support:** ZB : 149'0, 147'15, 145'20 ZN: 123'23, 123'10, 122'15 and 121'29
**Technical Resistance:** ZB: 152'06, and 152'25 ZN: 125'02, 125'16, and 126'0
Stock Index Futures
Late March is usually rough for stocks, but not this time.
The last few days of March have been known for sharp stock declines as funds square positions going into the end of the quarter. However, we are getting the opposite scenario. Funds NEED to be long stocks, so we are seeing some window dressing. Those looking for the market to collapse once the quarter ends will probably be disappointed.
April has historically been good for stocks. In fact, April is the best month for the Dow with an average gain of 1.9%. Also, the month of April has been up for stocks ten years in a row and has delivered solid performances in postpresidential election years since 1950 (according to the Stock Trader's Almanac).
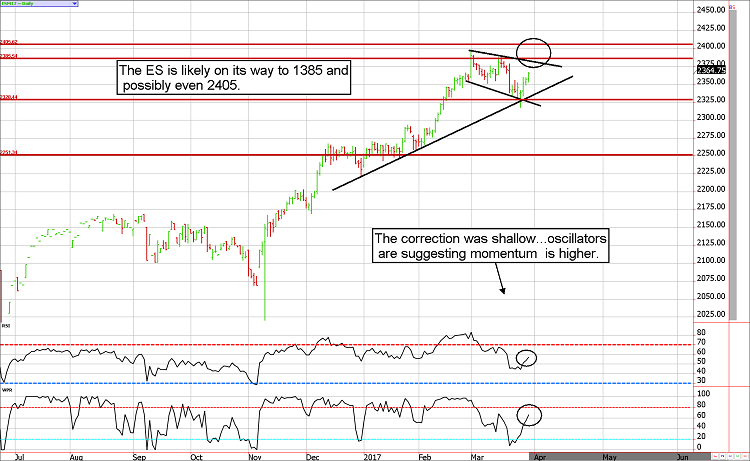
2405 in the June e-mini S&P, here we come.
Stock Index Futures Market Ideas
**e-mini S&P Futures Market Consensus:**
Supportive seasonals and technical momentum should lead the ES to 2405.
**Technical Support:** 2340, 2330, 2318, and 2251
**Technical Resistance:** 2385 and 2405
e-mini S&P Futures Day Trading Ideas
**These are counter-trend entry ideas, the more distant the level the more reliable but the less likely to get filled**
ES Day Trade Sell Levels: 2367, 2378, and 2390
ES Day Trade Buy Levels: 2330 and 2314
In other commodity futures and options markets....
March 9 - Sell June lean hog future near 77.00 and then sell a June 78.00 put. This offers a well-hedged bearish position with a profit potential of about $1300 but unlimited risk above 81.00.
March 9 - Buy July soybean $11.80 call for 7 cents or $350. This represents the total risk of the trade prior to transaction costs.
March 22 - Sell June Live Cattle 120 calls near 100/110.
March 29 - Exit June hhog covered put trade to lock in $750 to $800 before transaction costs per contract.
March 30 - Sell July Soybean $9.20 put for about 11 cents.
Disclaimer: **There is substantial risk of loss in trading futures and options.** These recommendations are a solicitation for entering into derivatives transactions. All known news and events have already been factored into the price of the underlying derivatives discussed. From time to time persons affiliated with Zaner, or its associated companies, may have positions in recommended and other derivatives. Past performance is not indicative of future results. The information and data in this report were obtained from sources considered reliable. Their accuracy or completeness is not guaranteed. Any decision to purchase or sell as a result of the opinions expressed in this report will be the full responsibility of the person authorizing such transaction. Seasonal tendencies are a composite of some of the more consistent commodity futures seasonals that have occurred over the past 15 or more years. There are usually underlying, fundamental circumstances that occur annually that tend to cause the futures markets to react in a similar directional manner during a certain calendar year. While seasonal trends may potentially impact supply and demand in certain commodities, seasonal aspects of supply and demand have been factored into futures & options market pricing. Even if a seasonal tendency occurs in the future, it may not result in a profitable transaction as fees and the timing of the entry and liquidation may impact on the results. No representation is being made that any account has in the past, or will in the future, achieve profits using these recommendations. No representation is being made that price patterns will recur in the future.
