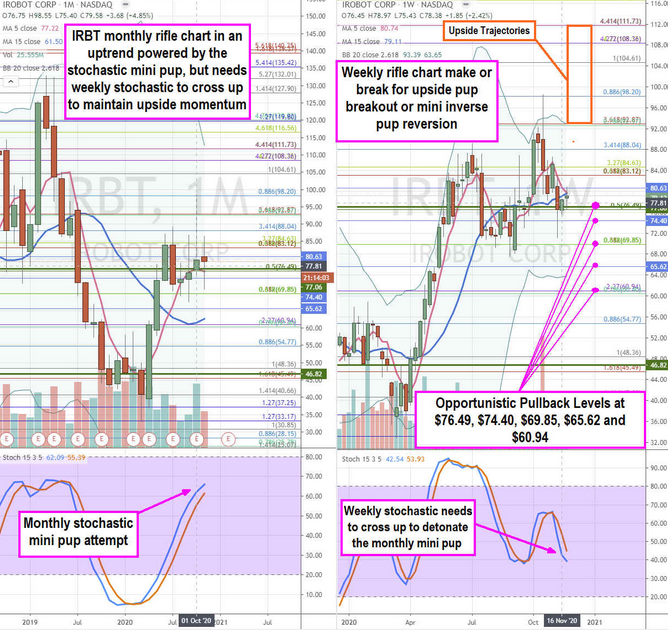
Consumer robotics manufacturer iRobot (NASDAQ:IRBT) stock has performed exceptionally well during the pandemic as the market has deemed it as a benefactor. Shares are outperforming the benchmark S&P 500 index but may be winding up for another move towards triple-digit range with the holiday shopping season underway. The shares have a history of blowing out earnings but triggering sell-the-new reactions as evidenced by its latest price action. Prudent investors can monitor opportunistic pullback levels to gain exposure at discounted prices.
Q3 FY 2020 Earnings Release
On Oct. 20, 2020, iRobot reported its fiscal third-quarter 2020 results for the quarter ending September 2020. The Company reported an adjusted earnings-per-share (EPS) profit of $2.58 versus consensus analyst estimates for EPS profit of $1.00, a monstrous $1.58 EPS blowout. Revenues rose 42.7% year-over-year (YOY) to $413.1 million beating analyst estimates for $314.67 million. Growth was driven by an 86% YoY increase in premium robot revenues and 36% overall unit growth. U.S. revenues grew 75%, EMEA grew 22% and Japan grew 21% YoY. Online sales have risen to 70% YoY. The Company ended the quarter with $357.3 million in cash and short-term investments. It includes $35 million in tariff-related refunds and $52 million in Teladoc (NYSE:TDOC) stock from the InTouch Health divestiture.
Conference Call Takeaways
iRobot CEO Colin Angle presided over the conference call. He highlighted some key developments in the quarter:
“Our Genius platform leverages our substantial investments across AI, home understanding and computer vision technology and supports a redesigned Home App.”
The Roomba i3+ expands the high-end line of self-emptying robot vacuum cleaners. iRobot is investing to expand its Genius Home Intelligence platform, which currently enables the higher end Roomba vacuums to be customized. Users can configure cleaning routines and specify Keep Out Zones.
The “collaborative intelligence of Genius” has driven higher customer engagement as owners are creating multiple favorite cleaning routines. The digital app has grown by more than 45% year-to-date with 7.8 million customers. The Company has held off on the launch of Terra, the robotic lawn mowing device perhaps to bolster the platform ahead of rollout. The Company is nurturing the lifetime value if its customers through its direct-to-consumer (DTC) channel as it grew by 155% YoY. The market for refurbished Roombas through its Roomba Restore program is one way of many services in the DTC channel that will galvanize customer engagement as well as generate new recurring revenues.
Mixed Guidance
The Company issued upside guidance for full-year 2020 EPS coming in between $3.43 to $3.53 versus $2.57 consensus analyst estimates on revenues of $1.365 billion to $1.375 billion versus consensus estimates of $1.23 billion. However, the Q4 2020 guidance was narrow with revenues expected between $80 to $90 million resulting in a 12% to 15% YoY growth rate. The Company expects travel related costs to increase in 2021.
China Tariff Risks in 2021
Shares sold off (-15%) on a sell-the-news reaction to an amazing Q3 earnings report. The Company has been under the exclusion period running until year-end with $25.4 million in refunds expected over the next three quarters. The Malaysian production facility to meet the scale of demand is expected by the end of 2021. This leaves the Company at risk for the reinstatement of 25% tariffs under Section 301 List 3. The pandemic delayed plans to bolster capacity in Malaysia but is confident the plant will produce the vast majority of US products by end of 2021. Until that transition, the “vast majority of products shipped in 2021 will be subjected to the 25% tariffs. The Company expects to be “well-positioned to enjoy gross margins and operating profitability tailwinds into 2022 and beyond.” This is causing the drag on shares heading into 2021, but also provides opportunities for prudent investors.

IRBT Opportunistic Pullback Levels
Using the rifle charts on the monthly and weekly time frames provides a broader view of the landscape for IRBT stock. The monthly rifle chart has been grinding an uptrend powered by the stochastic mini pup with a rising 5-period moving average (MA) at the $76.49 Fibonacci (fib) level. However, the upward momentum is staggered until the weekly rifle chart completes its make or break.
The weekly rifle chart triggered a second market structure low (MSL) above $77.06 but needs to get a stochastic cross up to detonate the monthly mini pup. If the weekly stochastic triggers a bearish mini inverse pup, prudent investors should be watching for opportunistic pullback levels at the $76.49 fib, $74.40 fib, $69.85 fib, $65.62 fib and the $60.92 fib. The upside trajectories range from the $92.87 weekly upper Bollinger Band fib towards the $111.73 fib. The 38% short interest in the stock can also ignite a lasting short-squeeze.
