
The US dollar continued to slide against most of its major counterparts, but although EU shares were mostly in the green, the US and Asian indices traded mixed. Today, market participants may focus on the US retail sales for March for more signs as to whether the world’s largest economy continues to recovery from the coronavirus pandemic at a fast pace.
The Dollar Stays On The Back Foot Ahead Of Retail Sales
The US dollar traded lower against the majority of the other G10 currencies on Wednesday and during the Asian session Thursday. It underperformed the most versus NZD, NOK, and AUD, while it eked out some gains only against CHF. The greenback was found virtually unchanged versus GBP and JPY.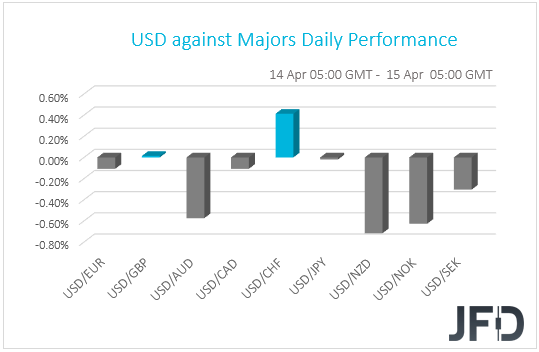
The weakening of the US dollar, the Swiss franc and the Japanese yen, combined with the strengthening of the risk-linked Kiwi and Aussie, suggests that markets traded in a risk-on fashion yesterday and today in Asia. Turning our gaze to the equity world, we see that most major EU indices rose, perhaps on upbeat earnings from the software firm SAP (NYSE:SAP) and the French luxury goods maker LVMH (OTC:LVMUY). The exceptions were Italy’s FTSE MIB and the German DAX, with the latter losing 0.17% after sources said that the Germany’s economic institutes will cut their joint 2021 growth forecast for the country to 3.7% from 4.7% due to a longer than expected covid-related lockdown.
Later in the day, in Wall Street, Dow Jones gained 0.16%, hitting a new all-time high, but the S&P 500 and the NASDAQ fell 0.41% and 0.99% respectively, although the former also hit a fresh record before pulling back. This happened despite stellar results from big banks on the first day of the earnings season.
The tech sector was the biggest underperformer, perhaps after Coinbase (NASDAQ:COIN) fell nearly 20% on its listing day. Asian shares were on the mixed side. Both Japan’s Nikkei 225 and South Korea’s KOSPI traded in the green, while China’s Shanghai Composite and Hong Kong’s Hang Seng slid.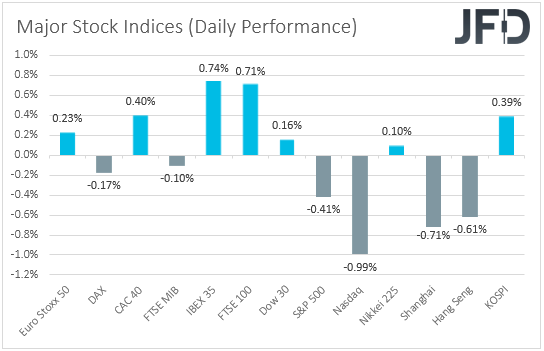
Today, market participants may turn their gaze on the US retail sales for March. Both headline and core sales are forecast to have rebounded 5.9% mom and 5.0% mom, after tumbling 3.5% and 2.7% respectively. This is likely to add more credence to the view that the world’s largest economy is recovering from the coronavirus pandemic at a fast pace, but it is unlikely to revive inflation fears.
After all, investors were not concerned at all after the headline CPI rate surged to +2.6% yoy in March, which means that they may have accepted the Fed’s view that any spike in inflation this year is likely to prove to be temporary. With the Committee also holding the view that it is too early to start discussing policy normalization, we believe that equities and other risk-linked assets may respond positively to the retail sales data. On the contrary, the safe-havens franc and yen may come under selling interest. As for the US dollar, it may instantly gain, but due to the Fed’s commitment to hold its policy extra loose for long, we would expect it to resume its recent slide.
EURO STOXX 50 Technical Outlook
The STOXX 50 cash index has been trading in a sideways manner since Apr. 1, between the 3950 support and the psychological zone of 4000. However, in the bigger picture, it continues to balance above the upside support line drawn from the low of Jan. 29, which keeps the near-term outlook positive.
Even if the price corrects lower, as long as it stays above the aforementioned upside support line, we would see decent chances for a rebound. The bulls may take charge from near the crossroads of that line and the 3875 support, marked by the inside swing high of Mar. 18, and push the action up for a test near the psychological zone of 4000, or the 4025 are, marked as a resistance by the inside swing low of August 2007. If that hurdle is not able to stop the rebound either, then we may see extensions towards the next psychological barrier, at 4100.
On the downside, we would like to see a break below 3840 before we start examining a short-term bearish reversal. The index would already be below the pre-mentioned upside line and may dive towards the low of Mar. 25, at 3783, or towards the inside swing high of Mar. 3, at 3740. Another break, below 3740 may see scope for declines towards the 3655 territory, marked by the low of Mar. 5.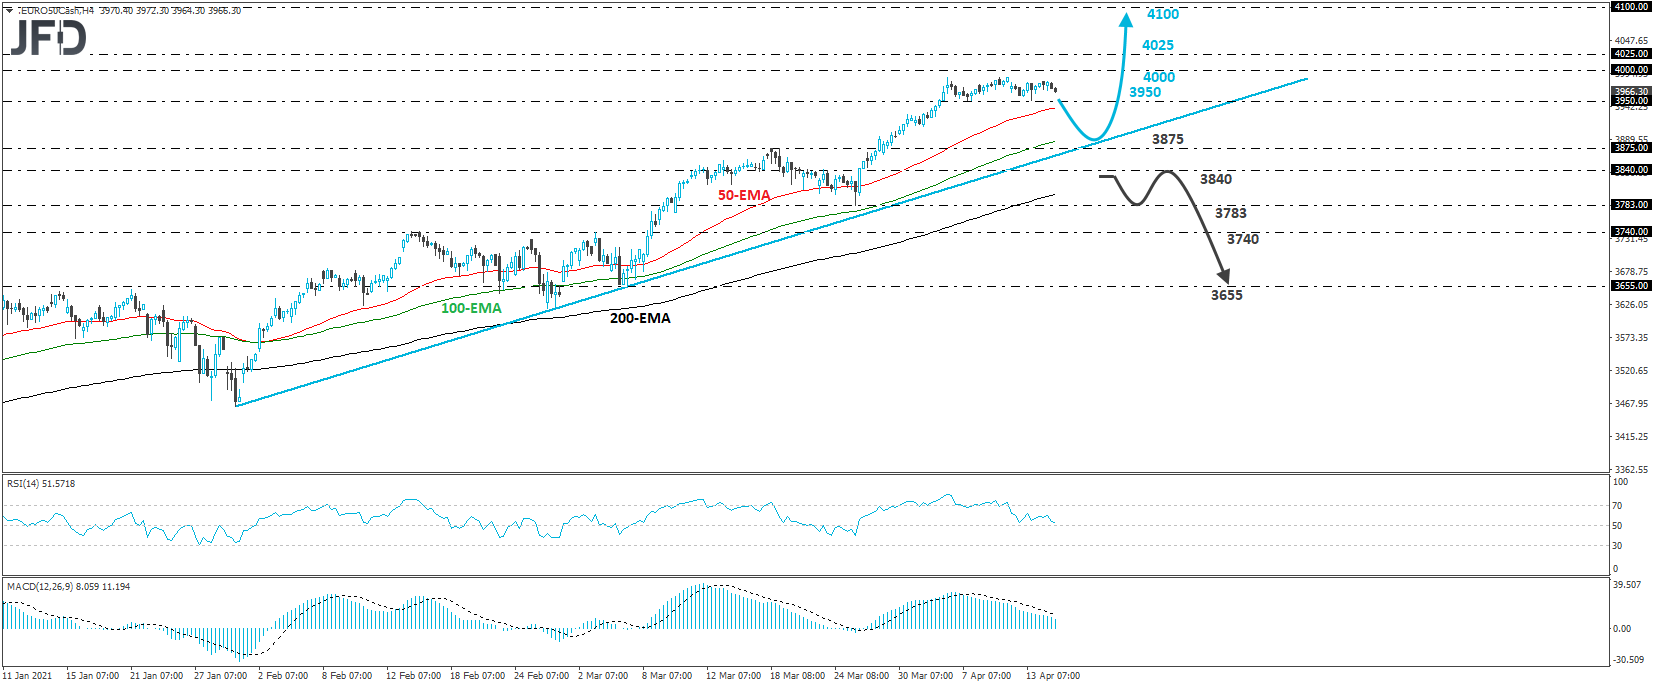
NZD/JPY Technical Outlook
NZD/JPY has been in a rally mode since yesterday, when it hit support near the 76.70 barrier. Overall, the pair is trading above a tentative upside support line drawn from the low of Mar. 24, and it is currently testing the highs of Apr. 2, 5 and 6, at around 77.94. With that in mind, we would like to see a move above that barrier, or even better above the peak of Mar. 22, at 78.13, before we bet confident on larger bullish extensions.
A clear and decisive break above 78.13 would confirm a forthcoming higher high and may encourage the bulls to drive the battle towards the 78.67 zone marked by the peaks of Mar. 15 and 16. If that obstacle is not able to stop the rally, then a break higher may see scope for extensions towards the high of Mar. 18, at 79.15.
We would abandon the bullish case only if we see a drop back below 76.70. The rate would already be below the aforementioned upside line, while a forthcoming lower low would be confirmed. The bears may initially target the 76.33 level or the 76.22 barrier, the break of which may carry declines towards the 75.76 zone, defined as a support by an intraday swing low formed on Mar. 25.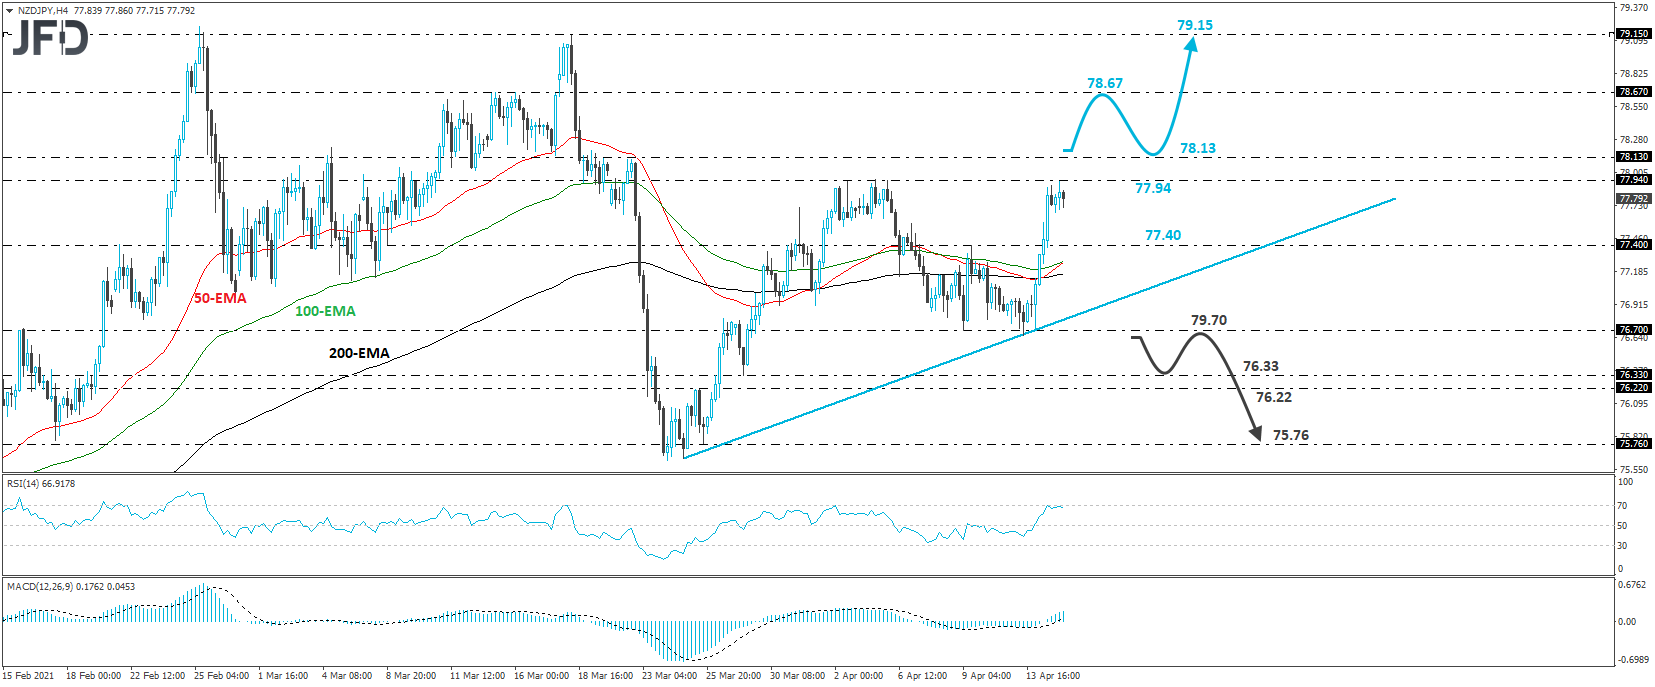
As For Today'e Events
During the European morning, we get Germany’s final CPIs for March, but as it is always the case, they are expected to confirm their preliminary estimates.
Later in the day, from the US, apart from the retail sales, we also have the initial jobless claims for last week, the New York Empire State manufacturing index for April, and the industrial production for March. Initial jobless claims are forecast to have declined to 700k from 740k, while the New York index is anticipated to rise to 19.50 from 17.40. Industrial production is expected to rebound 2.8% mom after sliding 2.2%. All this data will support the notion of a strong economic recovery in the US and may enhance the aforementioned market reactions.
As for tonight, during the Asian session Friday, we get China’s GDP for Q1, as well as the nation’s industrial production, fixed asset investment and retail sales, all for March. GDP is expected to have slowed to +1.5% qoq from +2.6%. IP, fixed asset investment and retail sales are all expected to slow as well. Having said that though, all prints are expected to stay on the strong side, with the yoy GDP rate anticipated to climb above 10% for the first time in a decade. Specifically, it is expected to jump to 18.9% from 6.5%, inflated by the coronavirus-related crash in the year-ago period. Data supporting that the world’s second largest economy has recovered from the coronavirus-related damages and is now performing very well, may allow market participants to increase further their risk exposure.
As for the speakers, we have three on today’s agenda and those are: Atlanta Fed President Raphael Bostic, San Francisco Fed President Mary Daly, and Cleveland Fed President Loretta Mester.