You may never have heard of Robert Rodriguez. For that matter, you probably did not know that he retired in December from California-based First Pacific Advisors (FPA). Yet he is the only mutual fund manager ever to win the Morningstar Manager of the Year award for a stock fund and for a bond fund.
In a recent interview, Mr. Rodriguez revealed that he has virtually zero exposure to stocks in his personal accounts. Liquidity? More than 65% via short-term Treasury-type securities.
Wow! And critics think that my 50% high quality stock/25% investment grade income/25% cash equivalent allocation is too ‘bearish.’
Those that have followed Mr. Rodriguez’ venerable career know that he practices what he preaches. As a value investor, he knows that stocks have historically grown at an average pace of 1.14 times the rate of earnings growth. What’s more, he sees trouble when stocks are growing five times more rapidly than earnings per share growth.
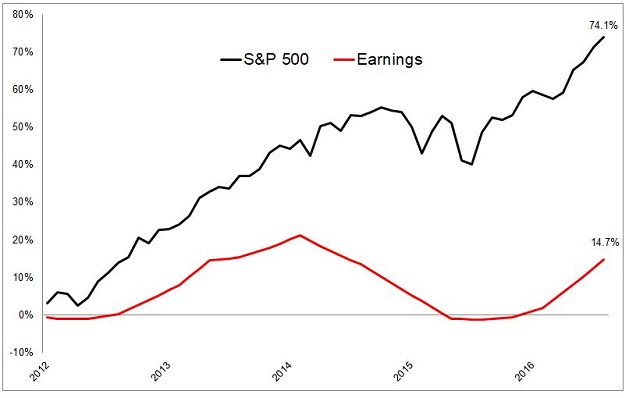
One of his sharpest barbs attacked the Federal Reserve. In essence, he scoffed at the notion that the central bank of the United States could avoid monumental policy error. After all, the institution has missed nine straight years of economic forecasts.
He also chimed in on the ‘FANG’ phenomenon. He said:
We’ve seen this act before. If you didn’t own the Nifty 50 stocks in the early 1970s, you underperformed and, thus, money continued to go into them. If you were a growth stock manager in 1998-1999 and you were not buying ‘net’ stocks, you underperformed and were fired. More and more money went into fewer and fewer stocks. Today you have a similar case with the FANG stocks.
Last week, I compared the FANG phenomenon to the ‘four horsemen’ of the late 1990s and the ‘Nifty 50’ of the early 1970s. Dissents from comment providers were plentiful. It is as though many do not believe that great companies can hit growth limits that adversely impact their stock values. Similarly, many do not understand what happens to the most leveraged stocks when margin calls occur.
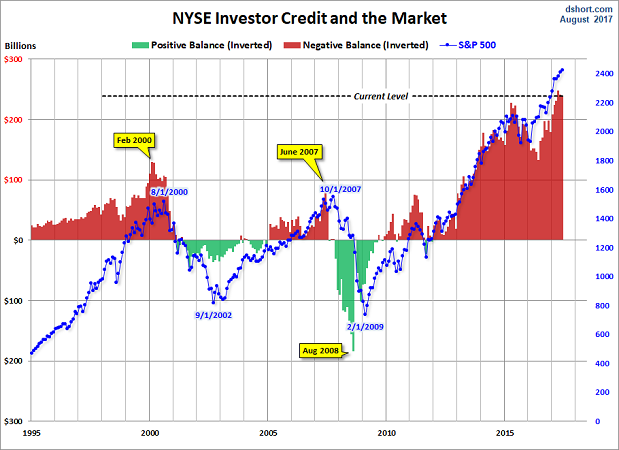
At the moment, of course, the absence of widespread fear is deafening. Around the edges, however, weakening market internals are worth monitoring.
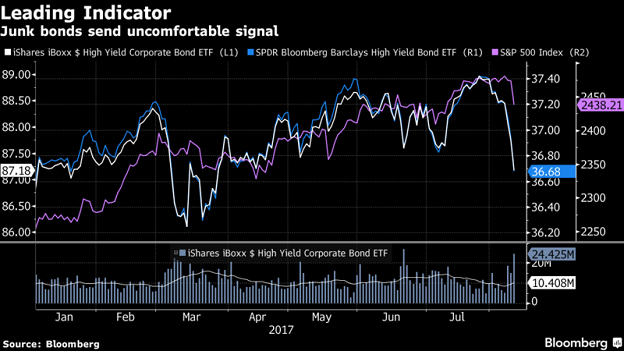
For instance, divergences between higher quality debt and credit-questionable junk debt have been materializing. On average, junk bond investors get roughly 3.7 percentage points of additional yield over comparable Treasuries. Spreads had been tighter, and now they are widening. A widening gap tends to be a ‘risk-off’ indication.
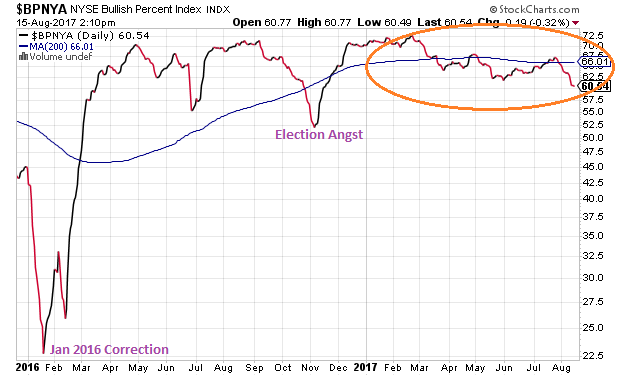
In a similar vein, the percentage of stocks holding above a 200-day moving average is declining. This implies weak breadth across the stock universe where fewer and fewer names are holding up the big-name benchmarks. Historically, if more and more individual securities dip below key trendlines, the benchmarks tend to buckle.
Equally worthy of note? Divergences have appeared in equity leadership. Specifically, the proportion of individual issues setting new highs as opposed to new lows has been decreasing.
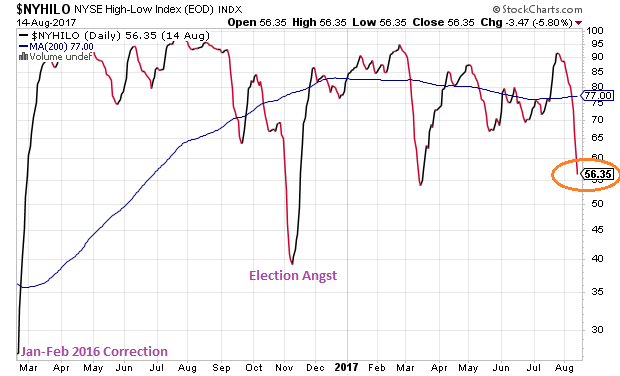
There’s more. There’s a widening rift between market capitalization, as large-cap performance has been decimating small-cap performance. Additionally, the split between growth-oriented stocks and value-oriented stocks is getting larger.
Perhaps one of the easiest ways to visualize what is happening is with a price ratio. The iShares Russell 2000 Small Cap Value (NYSE:IWN):iShares Russell 100 Growth (NYSE:IWF) price ratio has been in virtual free-fall since the start of 2017.
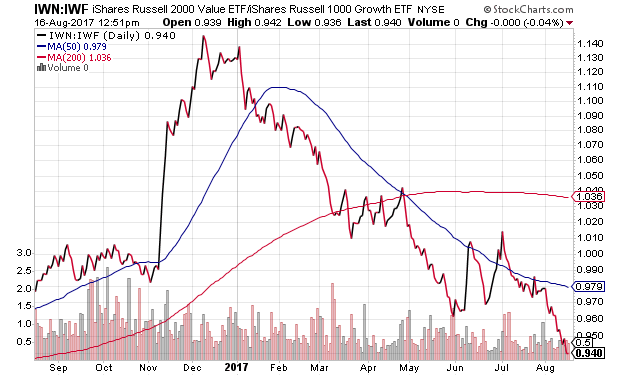
The evidence takes one right back to Mr. Rodriguez’ contention that more and more money is piling into fewer and fewer stocks. And, when this has happened in the past, riskier market-based securities often fell apart.
Granted, there are few obvious technical downtrends across industry sectors. The ‘losers’ have been losing for quite some time, from retail to telecom to energy. On the flip side, why are so many so quick to dismiss consequential segments of an economy? Do they not recall what happened as the term ‘ex-financial’ made the rounds in 2007?
From where I sit, it is difficult to dismiss energy from an earnings perspective. Most of the so-called growth that analysts have been projecting in S&P 500 earnings per share has relied on a global recovery in the energy patch. Yet stabilization for energy corporations is not the same as expansion.
Equally concerning? Consumers. Some analysts are extremely quick to dismiss record levels of household debt. They focus on low borrowing costs as though they will remain low indefinitely. They forget that headline unemployment is a lagging indicator that trails the economic cycle. And they ignore the reality that record levels of household net worth exist within the top 10%, where the overwhelming majority of Americans have not seen improvement in median real income since 1999.
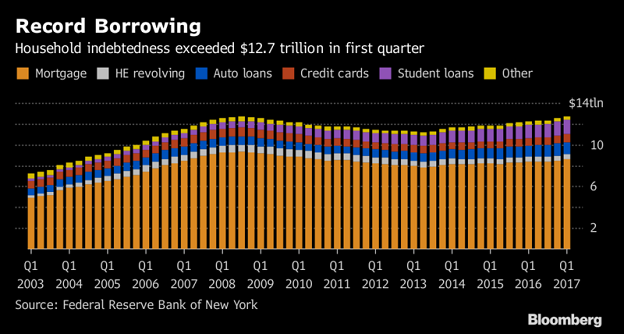
In sum, folks have to borrow to maintain a semblance of a standard of living. So what happens when banks lend less? What happens when credit card limits do not get extended? What happens when the credit cycle tightens as opposed to expands?
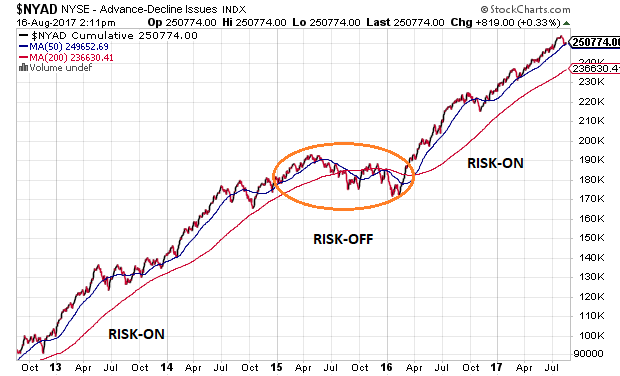
I am not advocating that one abandon all riskier holdings in favor of cash equivalents or physical assets. I respect the heck out of Robert Rodriguez, but I also respect the heck out of the closing monthly price on the 10-month moving average and the Advance/Decline (A/D) Line. It follows that a break down on my favorite technical indicators would be required before I reduce my equity allocation from 50% to 30%.
Disclosure Statement: ETF Expert is a web log (“blog”) that makes the world of ETFs easier to understand. Gary Gordon, MS, CFP is the president of Pacific Park Financial, Inc., a Registered Investment Adviser with the SEC. Gary Gordon, Pacific Park Financial, Inc., and/or its clients may hold positions in the ETFs, mutual funds, and/or any investment asset mentioned above. The commentary does not constitute individualized investment advice. The opinions offered herein are not personalized recommendations to buy, sell or hold securities. At times, issuers of exchange-traded products compensate Pacific Park Financial, Inc. or its subsidiaries for advertising at the ETF Expert website. ETF Expert content is created independently of any advertising relationship.
