
Most major EU indices traded in the green yesterday, but sentiment softened during the US session, and deteriorated even further today in Asia. With no major events to drive the markets yesterday, neither any top tier event on today’s agenda, we believe that participants are likely to stay cautious ahead of Wednesday’s BoC and Thursday’s ECB meetings, and especially the US CPIs for May, due out on Thursday as well.
Morale Softens Ahead Of BOC, ECB And US CPIs
The US dollar traded mixed against its major peers on Monday and during the Asian session Tuesday. It lost ground versus CHF and EUR, while it gained against CAD and AUD. It was found nearly unchanged against GBP, JPY, and NZD.
The strengthening of the Swiss franc and the weakening of the risk-linked loonie and aussie suggest that financial markets traded in a risk-off manner yesterday and today in Asia.
However, shifting attention to the equity world, we see that most major EU indices closed in positive waters, with the only exception being Germany’s DAX, which slid 0.10%.
Investors’ morale softened though during the US session, with both the Dow Jones and the S&P 500 sliding, and only NASDAQ ending positive. Risk appetite deteriorated even further during the Asian session today.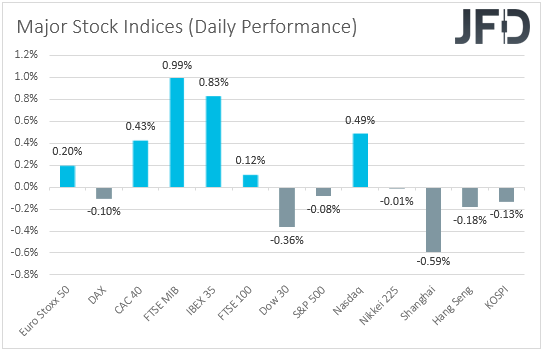
Lately, the main market theme has been the surging inflation around the globe, and how this can affect central bank decisions moving ahead.
On Thursday, the US data is forecast to show that both the headline and core CPI rates have continued to climb well above the Fed’s target of 2%. In our view, the fact that underlying inflationary pressures are rising as well raises questions as to whether the spike in headline inflation is due to transitory factors, as the Fed initially supported.
Now, with several policymakers arguing that they need to start discussing policy normalization at the upcoming gatherings, further acceleration in consumer prices may increase speculation for the Committee acting sooner than previously thought, and thereby result in a pullback in equities and other risk-linked assets. At the same, the US dollar and other safe havens may strengthen.
Now, flying to Canada, there, inflation accelerated in both headline and core terms as well. However, Friday’s weak employment report is likely to prevent BoC from reducing further their bond purchases on Wednesday.
We believe that after doing that at the prior gathering, they can wait for now. In any case, an upbeat tone in the Bank’s statement, hinting that more tapering is in the works for the months to come, is likely to keep the Canadian dollar supported.
Returning to the Eurozone, things here are different. Although we saw headline inflation spiking notably higher, the core rate stayed subdued. This means that indeed, the rising headline inflationary pressures are due to transitory factors.
Having that in mind, and also that several ECB policymakers continue to support an extra-loose policy stance, we don’t expect this Bank to discuss QE tapering at all this week. Therefore, if this is the case, we will focus on the updated economic projections and hints as to whether the recovery is satisfying enough.
FTSE 100–Technical Outlook
The technical picture of FTSE 100 shows that the index is still trading above a short-term tentative upside support line taken from the low of May 19. However, at the same time, the price remains below a short-term tentative downside resistance line taken from the high of May 10.
In order to consider the next short-term directional move, a break of one of the above-mentioned lines is required. Until then, we will take a neutral stance.
If, eventually, the index breaks the aforementioned downside line and makes a move above the 7123 barrier, marked by the current highest point of June, this will confirm a forthcoming higher high, possibly clearing the path towards higher areas.
The FTSE 100 could then drift to the 7139 barrier, marked by an intraday swing low of May 10, where the price might stall for a bit. That said, if buyers are still active, they could easily push the index towards the highest point of May, at 7167.
Alternatively, if the previously mentioned upside line breaks and the price falls below the 7038 hurdle, marked near the lows of June 4 and 7, that could bring more sellers into the game. The FTSE 100 might then be sent to the 7012 zone, marked by the low of June 3, which could halt the slide temporarily.
The price may even rebound somewhat, however, if it continues to trade below the above-mentioned upside line, another slide might be possible. If this time the FTSE 100 is able to bypass the 7012 area, this could open the door for a move to the 6988 level, marked by the low of May 28.
NZD/JPY – Technical Outlook
NZD/JPY is currently trading between two of its short-term lines, a downside one drawn from the high of May 27, and an upside one taken from the low of May 24. Also, the pair is stuck in between its EMAs on our 4-hour chart. For now, we will take a neutral stance and wait for a violation of one of the lines, before examining the next short-term directional move.
If the aforementioned downside line surrenders and the rate climbs above the 79.14 barrier, marked by yesterday’s high, that could invite more buyers into the game, potentially opening the door for further advances.
NZD/JPY might travel to the 79.45 obstacle, which if it fails to provide resistance and breaks, may set the stage for a possible move to the 79.79 level. That level marks the current highest point of June.
On the other hand, if the previously discussed upside line gets broken, this may scare some of the bulls away for a while. More bears might join in, possibly pushing NZD/JPY lower, towards the 78.57 hurdle, marked by the current lowest point of June, where a temporary hold-up could occur.
That said, if sellers continue to apply pressure, they may force the pair to slide further and aim for the 78.22 zone, marked by an intraday swing high of May 24.
As For Today's Events
During the EU trading, Germany’s ZEW survey for June is due to be released. The current conditions index is forecast to have risen to -28.0 from -40.1, while the expectations one is anticipated to have inched up to 85.3 from 84.4.
Eurozone’s final GDP for Q1 is also coming out, alongside the final employment change for the quarter. As it is usually the case, the final prints are expected to confirm their preliminary estimates.
Later in the day, we get Canada’s trade balance for April and the US JOLTs job openings for the same month. Canada’s trade deficit is expected to have narrowed somewhat, while no forecast is available for the US JOLTs number.
As for the speakers, we have only one on today’s agenda and this is BoE Chief Economist Andy Haldane.