
Yesterday, the three major US indices took a dive and closed with a loss of around three quarters of a percent. The US delivered its weekly initial and continuing jobless claims, which came out on the less pleasant side. Today, the most important data set may be Canada’s employment report for June.
Indices Retreat Slightly
Yesterday, the three major US indices took a dive and closed with a loss of around three quarters of a percent. The increased talks about various virus variants around the globe have made investors worry about the near-term economic outlook. The fear is that there could be a sudden shift towards new lockdowns, which might be adapted by governments across the globe. We saw safe-haven currencies, such as JPY and CHF strengthening against its major counterparts, due to a risk-off trading environment. Risk currencies, such as AUD and NZD declined, as fear took over. However, for now, all this might just be a temporary corrective move lower before another possible rise, unless the Fed starts hinting more actively on the issue of raising rates, or if the Covid situation becomes worse globally.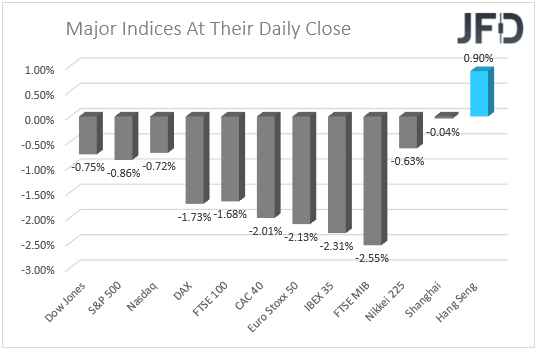
Economic Data
The US delivered its weekly initial and continuing jobless claims, which came out on the less pleasant side, showing up above their initial forecasts. The initial claims were at 373k, which was above the forecast of 350k, but still near the revised previous number of 371k. The continuing jobless claims came out at 3339k, which is slightly above the initial expectation of 3335k. However, it wasn’t above the previous revised figure of 3484k. Most likely, the figures kept investors worried, as they might have hoped for a more rapid decline in the number.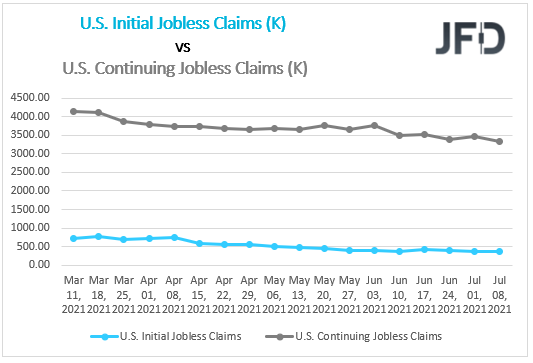
During the early hours of the Asian morning, China delivered its inflation numbers for the month of June on MoM and YoY basis. The initial forecast was for the YoY number to come out the same as the previous +1.3% and for the MoM one to improve from-0.2% to -0.1%. However, that was not the case. Both figures fell, where the YoY one dropped to +1.1% and the MoM one declined to -0.4%. The main driver behind the decline was a decrease in food prices, mainly of pork. However, transportation and communication prices, together with clothing, rent, fuel, utilities and health, those have increased slightly. But the small collective increases were not able to outweigh the
One European country, which also delivered its CPI readings for June on a MoM and YoY basis was Norway, which also were a slight disappointment. Although the YoY figure met its forecast of +2.9%, the MoM number came out at +0.3%, which slightly below the initial expectation of +0.4%. The numbers did not have any big effect on the Norwegian krone.
During the early hours of the European morning, we have received the MoM GDP figure from the UK. There were no initial forecasts available, but the actual reading showed up at +0.8%, which is below the adjusted previous figure of +2.0%. In general, the indicator has been on a gradual decline since May. The British currency did not react much on the news.
FTSE 100 Technical Outlook
Before yesterday, the FTSE 100 was trading inside a triangle pattern, which has been forming from around mid-June. However, yesterday, the price exited the lower side of that pattern and made its way lower. This morning, the index managed to recover some of its losses, but if it won’t be able to the move back inside the triangle, another decline could be possible. Hence our cautiously bearish approach for now.
As mentioned above, if the FTSE 100 is not able to climb back above the lower side of the aforementioned triangle, the bears might take advantage of the higher price and push it down again. If so, the index could fall to the 7005 obstacle, or to the 6979 zone, marked by yesterday’s low. If that zone is not able to withstand the bearish pressure and breaks, this would confirm a forthcoming lower low, possibly sending the FTSE 100 to the 6946 level, which is the lowest point of June.
On the upside, if the price climbs back inside the previously discussed triangle pattern and pushes through the 7088 hurdle, marked by the low of July 7, that could invite a few extra buyers into the game. Such a move may help the FTSE 100 to move to the 7115 obstacle, or even to the 7145 area, marked by an intraday swing low of July 7. Around there the index could test the upper side of that triangle.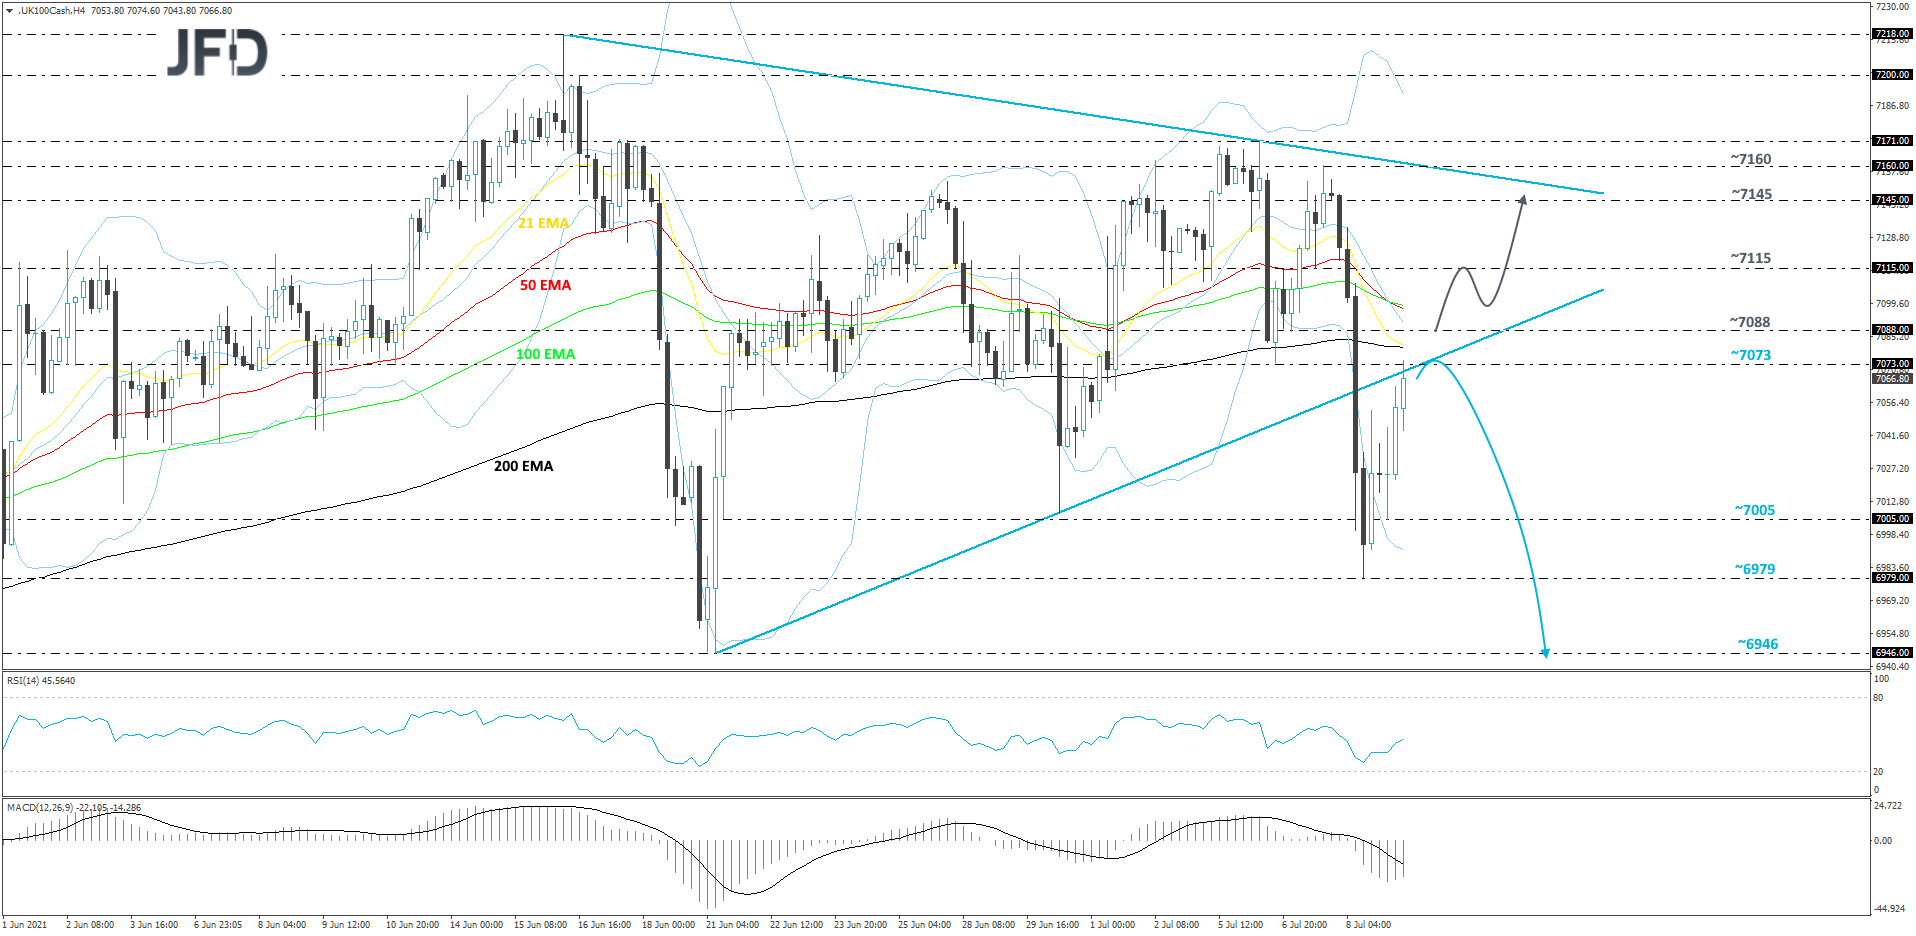
Canada Employment
Today, the most important data set may be Canada’s employment report for June. The unemployment rate is anticipated to have declined to 7.8% from 8.2%, while the net change in employment is forecast to reveal that the economy has added 175.0k jobs, after losing 68.0k in May. At their latest gathering, BoC policymakers kept their monetary policy settings unchanged and noted that any adjustments to the pace of their QE purchases will be guided by the ongoing assessment of the strength and durability of the economic recovery. In our view, the absence of strong hints with regards to further tapering in the upcoming months may have disappointed some Loonie traders, but a strong employment report may revive speculation that more tapering could be on the cards for the months to come, and thereby encourage some CAD-buying. That said, if suddenly oil falls heavily, this might drag the Canadian dollar to the downside against some of its major counterparts, such as EUR, GBP and USD.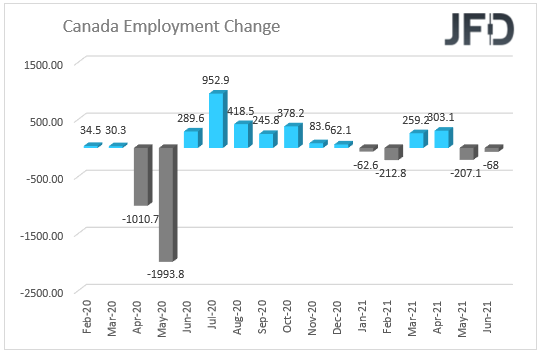
GBP/CAD Technical Outlook
Yesterday, after hitting a resistance area near the 1.7340 barrier, GBP/CAD reversed lower and is now approaching a short-term tentative upside support line taken from the low of July 2nd. Even if the rate moves a bit lower, as long as that upside line provides support, another push higher could be possible.
As mentioned above, a small decline may bring the pair closer to the aforementioned upside line, which if holds, could attract the bulls back into the field. GBP/CAD might then drift back to the 1.7295 obstacle, or even to the 1.7340 zone, marked by yesterday’s high. If the buying doesn’t stop there, slightly above that zone sits another potential resistance level, at 1.7361, marked by the high of Apr. 26.
Alternatively, if the previously mentioned upside line breaks and the rate falls below the 1.7192 hurdle, marked by the high of June 30, that could open the path for further declines. The pair could slide to the area between the 1.7128 and 1.7148 levels, which mark the high of July 5 and the low of July 7 respectively. If the selling continues, GBP/CAD might move to the 1.7064 level, which is an intraday swing of July 5.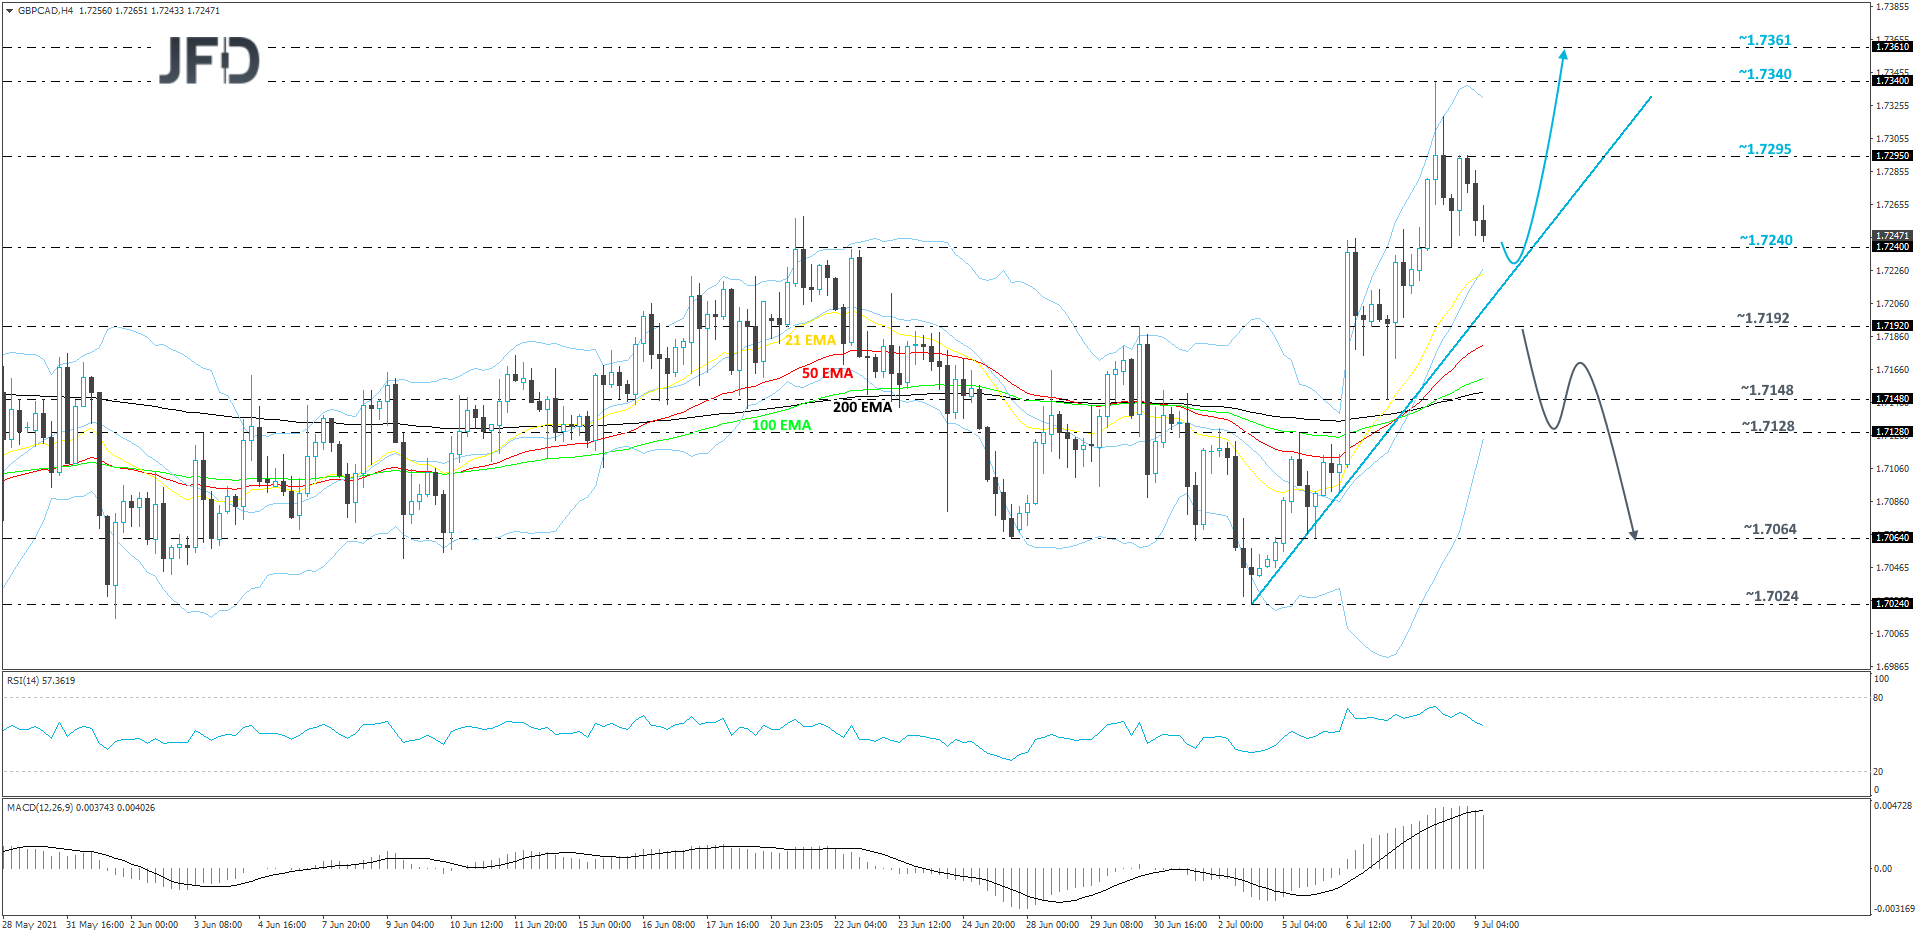
As for the rest of today’s events
UK will also deliver the NIESR monthly GDP tracker number. There is no forecast available at the moment, however, the previous reading was +3.8%, which has been improving over the past few months.