Have we already witnessed the bursting of a stock balloon? Or, in contrast, have we merely experienced a volatile corrective phase in the continuation of the longest bull market on record?
According to research at GMO, the bubble has burst and there is more downside to come.
The author of a recent GMO white paper, Martin Tarlie, establishes effervescent particulars in a historical context. Specifically, when valuations become temporarily explosive — 1929, the late 1990s, 2017-18 — they are “averting the mean.”
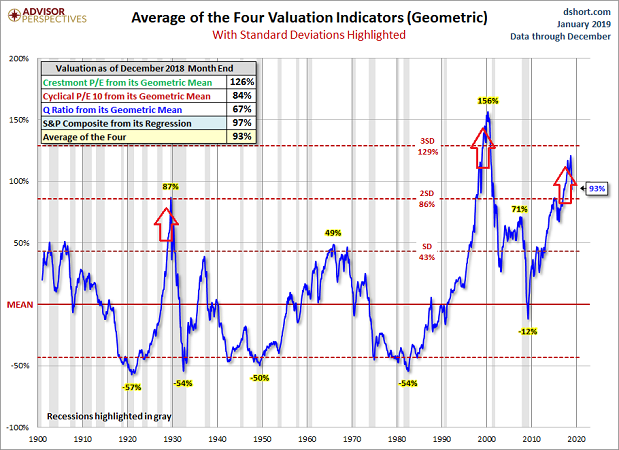
Of course, “mean aversion” does not last. And reversions back to mean valuations tend to occur with extraordinary speed.
It is worth noting, however, that the 50% drop in the S&P 500 from 2000-2002 did not result in a complete reversion. On the flip side, the 50%-plus decimation in 2008-09 did move from 71% above the mean to 12% below it.
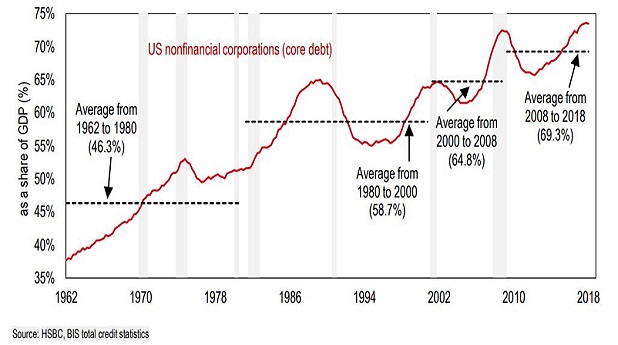
The takeaway here is that, even after the December destruction, traditional valuation methodologies peg stocks at higher valuation extremes than 1929 or 2008. Granted, lower rates may justify higher valuations to some extent, but not when the Fed leans towards rate hikes and quantitative tightening to reduce its balance sheet. And not when corporate debt-to-GDP is already at record highs.
The GMO white paper also discusses what causes bubbles to burst. They pop when sentiment shifts from positive to negative.
Many technical analysts interpret sentiment through market internals. For example, when there are more stocks hitting new 52-week highs than 52-week lows, sentiment is positive; when more stocks are hitting 52-week lows than 52-week highs, sentiment is negative.
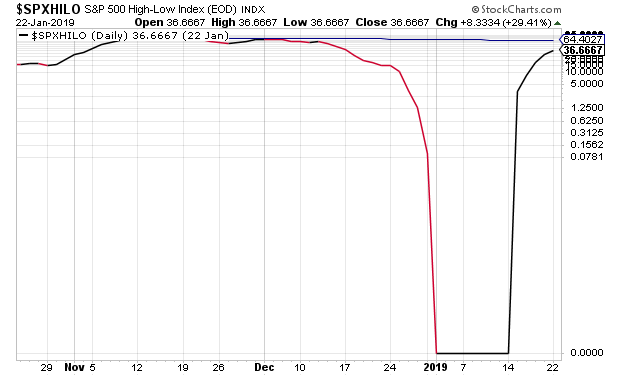
Granted, 36.6 is a marked improvement from the big “zero.” Nevertheless, readings under 50 are generally regarded as negative sentiment.
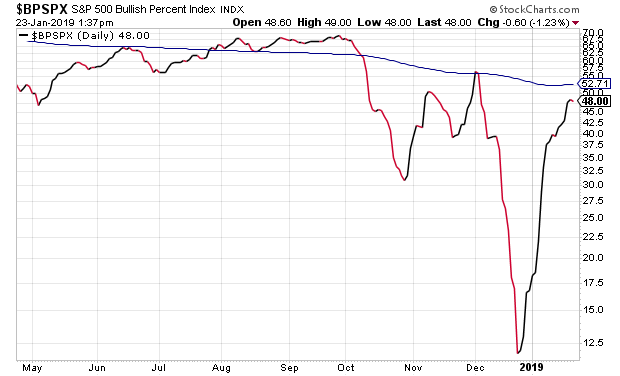
Another indicator? Bullish percentage. The greater the percentage of stocks in uptrends, the more positive the sentiment. The lower the percentage, the more negative the sentiment.
Here we see a bit more improvement than we do in the high-low indicator. And yet, we’re still talking about less than half of S&P 500 stocks in a bona fide uptrend.
Others posit that a near-term sentiment line in the sand exists. Where is it? Around 2650 on the S&P 500.
In October and November of 2018, the 2650 level served as support for stocks to bounce. When the levels broke in early December, the S&P 500 dropped like an anvil to a closing low of 2351. (Note: It should not be lost on anyone that the large-cap barometer closed a hair above 2344, the price point that would have served as a 20% top-to-bottom bearish decline.)
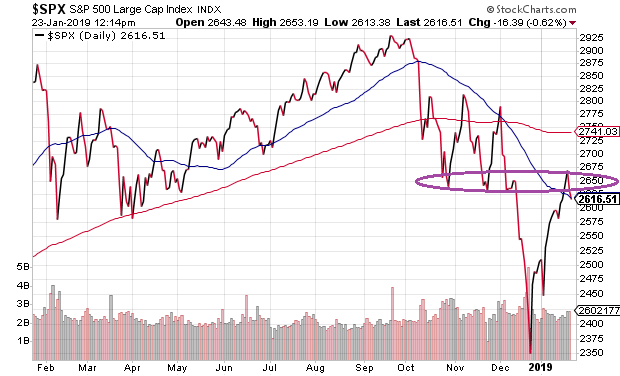
The rally back to respectability since December 26th has been equally swift. Now, however, the 2650 level has moved from support to resistance.
Bulls may need to see the S&P 500 punch through and stay through resistance. Meanwhile, bears might garner even more conviction should the resistance prove particularly difficult.
Naturally, there other ways to look for sentiment shifts. For instance, an increase in the spread between corporate bonds and comparable Treasuries is generally regarded as a sign that investors are worried about risk.
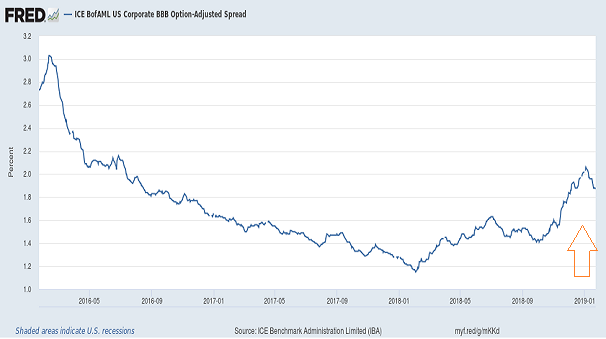
Could “so-so” sentiment get over the hump? Could the investment community fall back in love with risk-taking at current prices and valuations?
Maybe.
The Federal Reserve’s pledge to be patient is beneficial in the near-term. Plus, an end to the government shutdown coupled with meaningful progress on the trade front could restore consumer and business confidence.
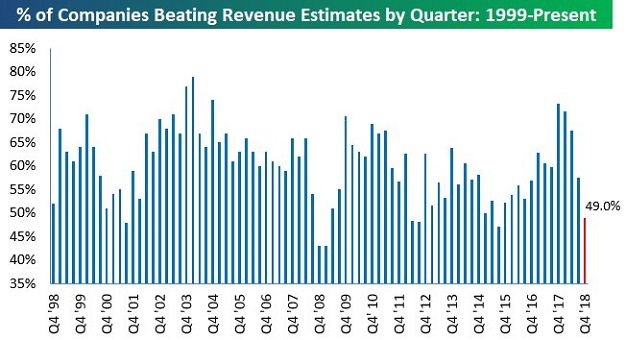
Still, less than 50% of companies are beating revenue expectations. That’s worrisome. It implies that most of the tax reform savings and corporate debt binging went into stock buybacks to boost earnings per share (EPS) perceptions. That has propped up investor sentiment in recent years, but it may not do the trick in 2019.
