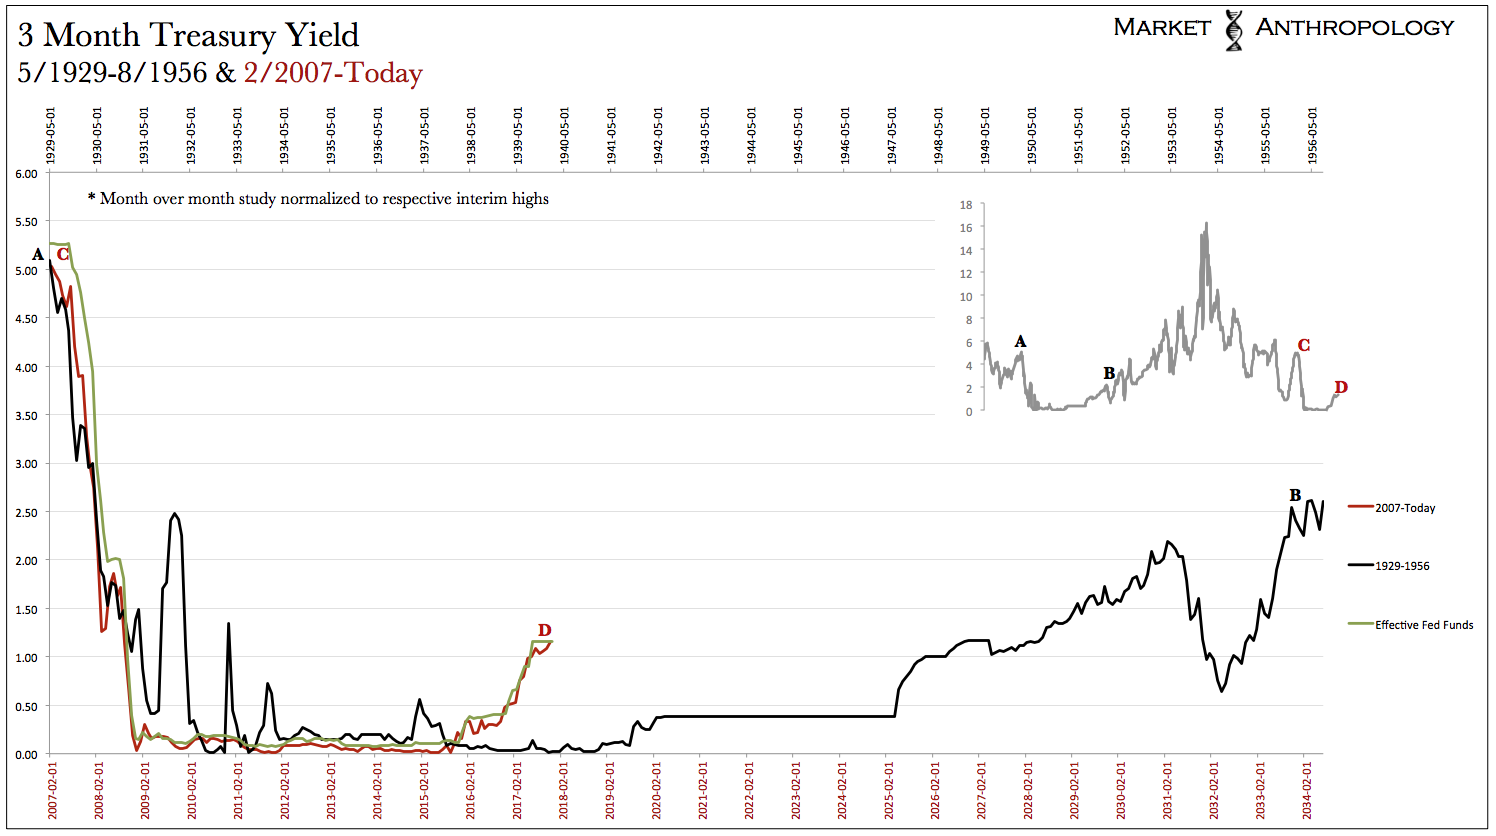
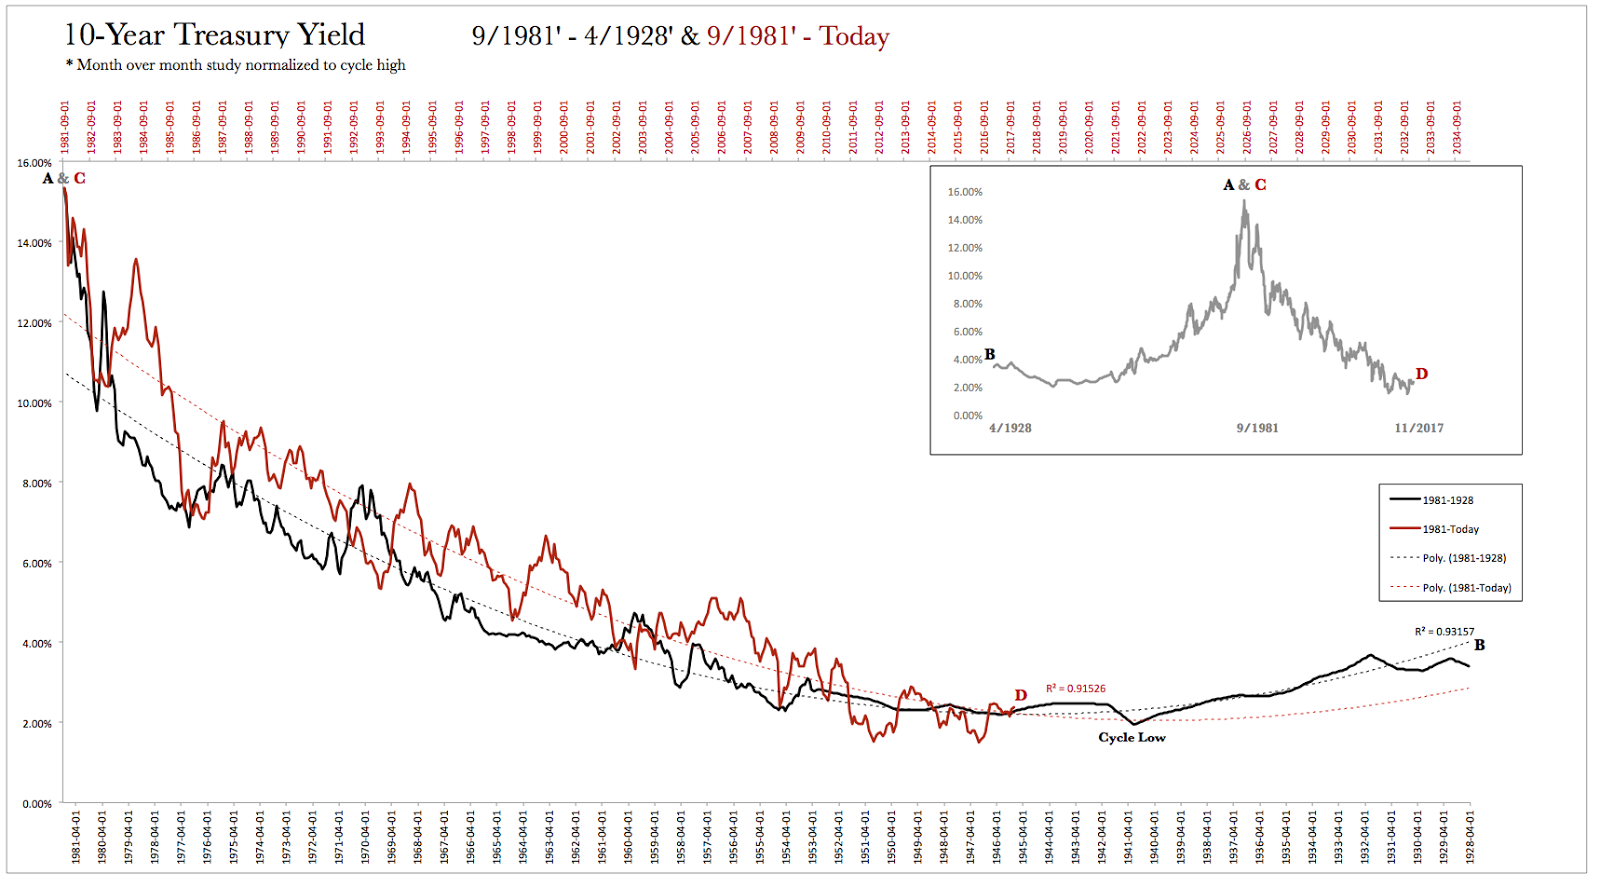
Traders looking for a steeper yield curve continue to see spreads come in as confidence builds for another rate hike by the Fed next month, while weak convictions persist towards rising inflationary pressures next year. This week, the combination of expectations saw the spread between the 2 and 10-year Treasury yields at its narrowest since November 2007.
Although causation may lie in the eyes of it’s beholder, it does at the very least suggest that collective wisdom believes future inflation will remain subdued, despite a continued tightening in the US labor market, a baker’s trillion in global QE accrued within the system since November 2007 – and a US dollar likely on the backside of it’s cyclical peak.
Nevertheless – and regardless of motivation, the tightening of spreads between shorter and longer-term Treasuries that really began as the Fed floated, then enacted the taper in December 2013, appears to be as stretched as this year’s move in equities to another historic valuation extreme. When the dust settles after the next inevitable pivot, will long-term yields rise faster than the short-end of the curve – because the reach of inflation is greater than the Fed’s capacity to tighten, or will the long-end steepen simply because short-term yields fall faster as rate hike expectations recede? In either case: an economy becoming too hot or an economy turning down – and even a combination of both (i.e. stagflation), gold is positioned to outperform as the benevolent conditions against which the equity markets have advanced with begin to diminish.
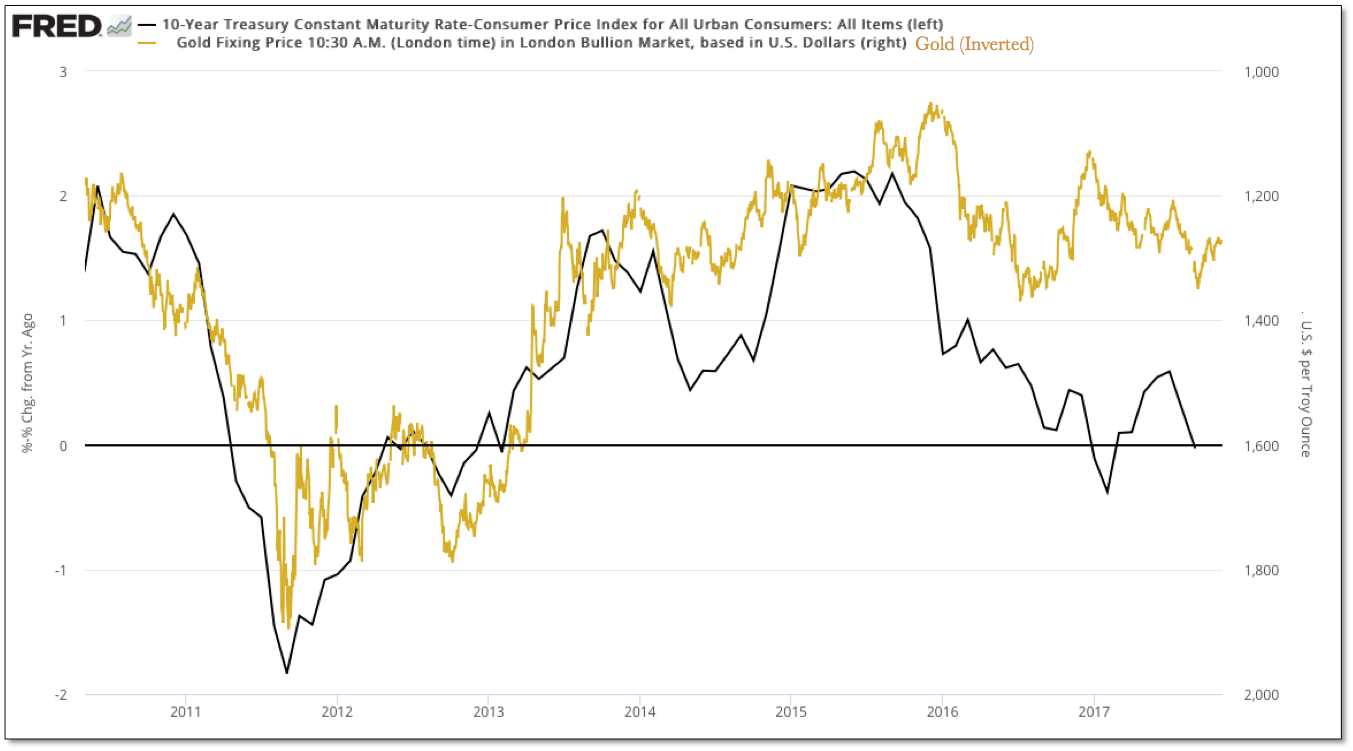
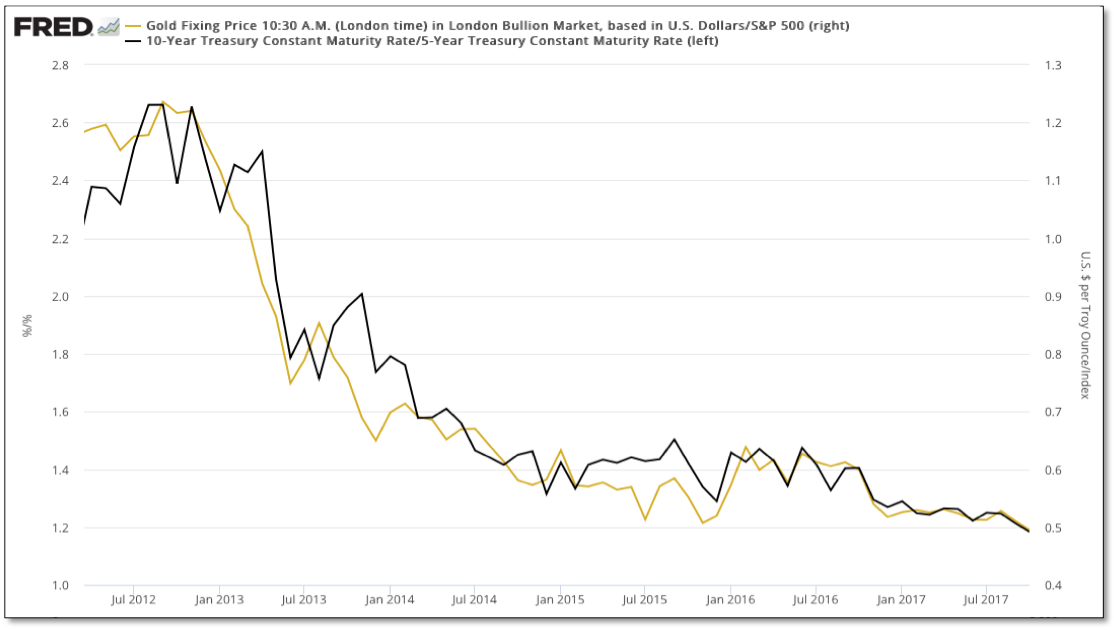
While on an absolute basis it was the pivot lower in real yields at the end of 2015 that drove the cyclical turn higher in gold (inverted here), on a relative performance perspective we will be looking for Treasury spreads to widen as longer-term yields "outperform" the short-end of the curve. As shown below, the relative performance of the 10-year versus the 5-year yield has trended closely with the performance of gold relative to the S&P 500.
Similar to following the yield curve for greater bearings in the market, over the years in previous notes we’ve commented on the relative performance trend in Treasury yields as a more discrete indication of the Fed’s policy shifts away from the extraordinary easing initiatives that began during the global financial crisis and were built-out in several phases in its wake.
Because of the more unconventional and esoteric nature of these policies that were enacted in large part because of the inherent limitations of ZIRP, we’ve followed the relative performance trend between the 5 and 10-year Treasury yields as indication of the market's expectation shift that first transpired with the taper tantrum in May 2013. We chose to highlight and contrast the relative performance between 5 and 10-year yields, as we felt the shorter durations of the market had been disproportionally influenced by ZIRP and the Fed.
In May 2013 the Fed began to telegraph their intentions to begin a tapering later that year of the massive monthly QE program, which caused short-term yields to surge relative to the long-end of the curve; conditions greatly similar to the build-up of the Fed’s previous tightening cycle that began in June 2004. Generally speaking, yields along the shorter end of the market tend to either "outperform" or "underperform" longer-term yields as the Fed moves between tightening or easing monetary policy. Naturally, when the Fed tightens, shorter-term yields outperform – and vice versa as they ease.
*Contrary to the previous chart shown, the chart below uses the inverse series (5yr:10yr and SPX:Gold) as they have historically trended with the Fed funds rate.
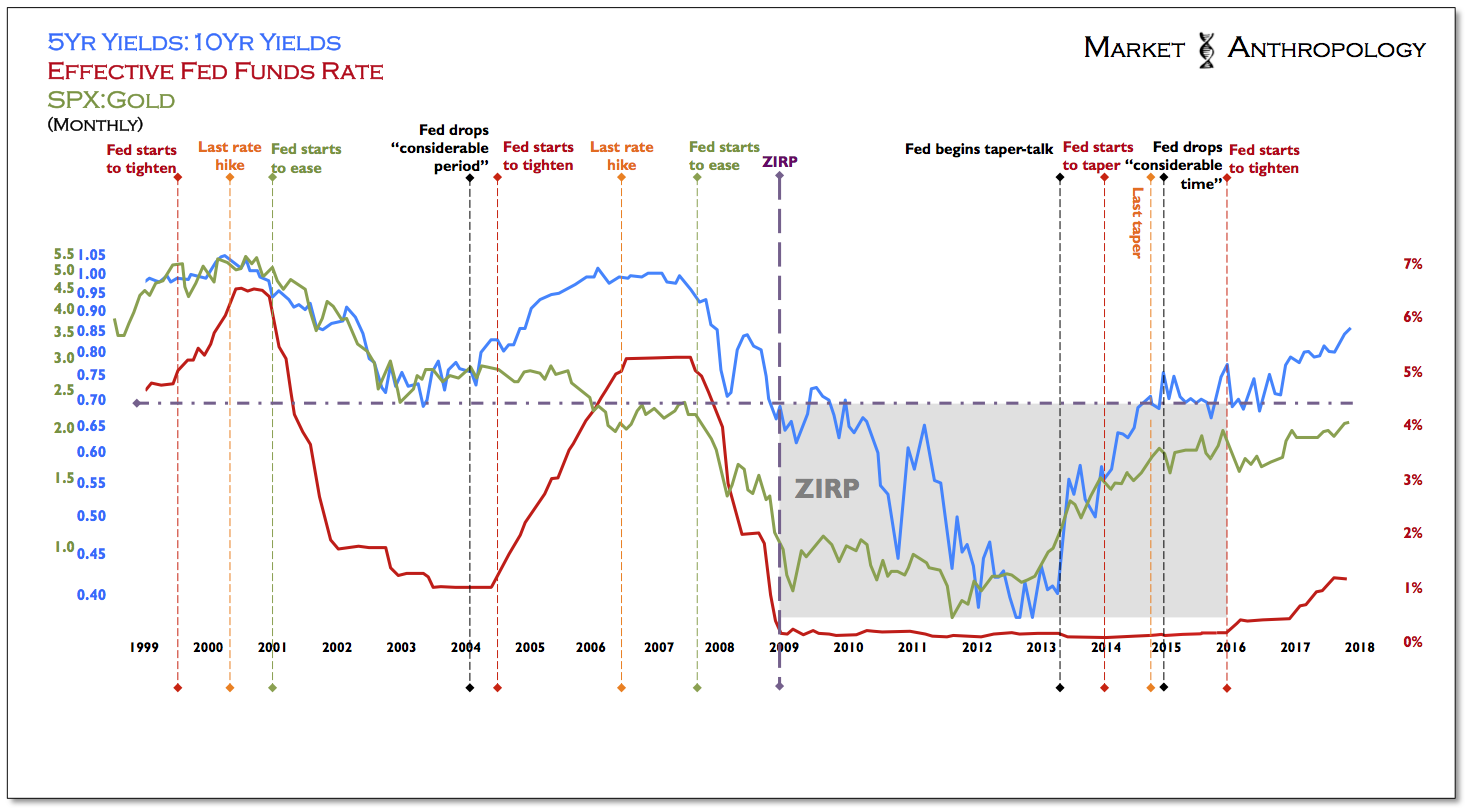
In January 2004, the Fed first telegraphed to the market by removing the phrase that rates would remain low for a “considerable period”. By the end of June of that year, the Fed had begun to gradually raise rates. Less than two years later in February 2006, the relative performance differential between 5 and 10-year yields had reached its peak four months before the end of the rate tightening cycle later that June.
The uniqueness of the current Fed tightening cycle – which we had noted at the time, is that the majority of tightening actually took place during the expectation and tapering period away from QE, rather than the second phase that we’ve currently been in since December 2015 of actual rate hikes. This makes sense as the “tightening” was enacted on a greater relative perspective to already historically extraordinarily accommodative policies, rather than more material interest rate hikes typical of conventional tightening cycles.
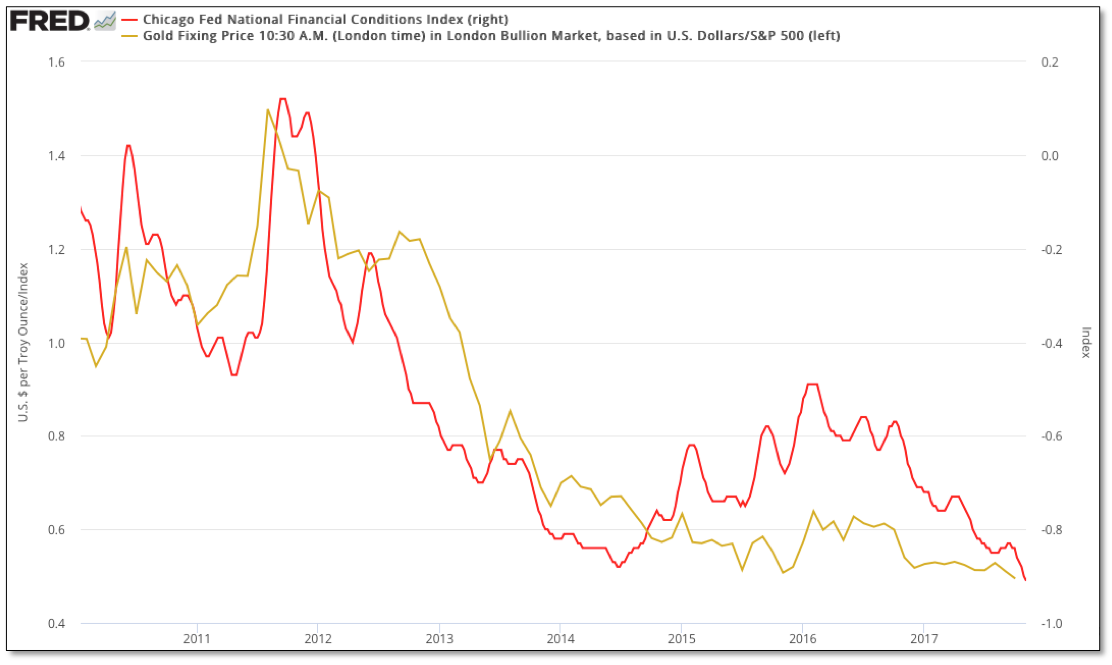
Moreover, by some measures conditions were the tightest a few weeks after the initial rate hike in December 2015 and have steadily fallen even as the Fed has further raised the funds rate – as displayed by the Chicago Fed National Financial Conditions Index that hit a more than 20 year low this month. Not surprisingly, gold relative to equities has loosely trended with the index.
All things considered – which should also take into account a historic perspective of the last time yields were this low (spot the outlier below), it's a decent bet that the spread between short and long-term Treasury yields will widen – and with it a greater outperformance in gold.
