Get 40% Off
🚨 Volatile Markets? Find Hidden Gems for Serious OutperformanceFind Stocks Now

Intel Set To Soar

Published 12/13/2016, 06:14 PM
Updated 07/09/2023, 06:31 AM


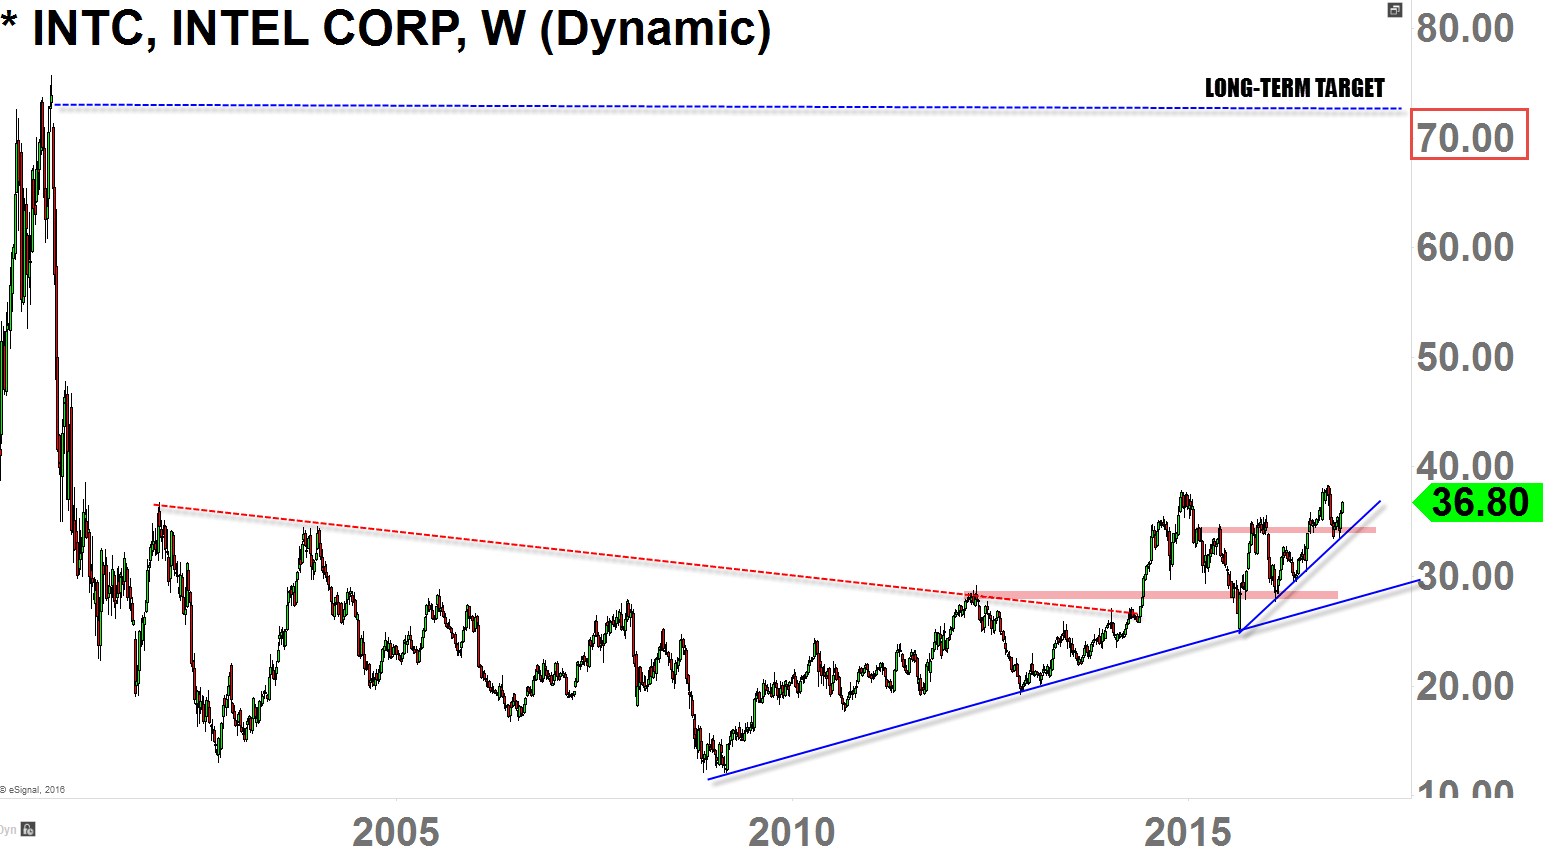
Long-Term Target

Intel Weekly Chart

It's absolutely amazing to see how Intel (NASDAQ:INTC) has been cultivating the base for the last 15-years, since the crash in 2000.

It was a tough bet for investors who bought after the crash in 2000, as they are now finally reaping harvest after 16-years of waiting.

But, if you've been long in this stock recently (for long-term traders and investors), it's probably the best time to get in for the all-time-high target around 70s within 5-years.

Looking at the chart pattern, we can see that the downtrend (dotted red) resistance has been nullified, and now the uptrend (blue line) has been developing since 2010, while faithfully establishing higher lows and higher highs.

Recently, (2016) we have formed a more intermediate-term uptrend and it looks to move much higher with intermediate term target of 42-43.

Our Holdings
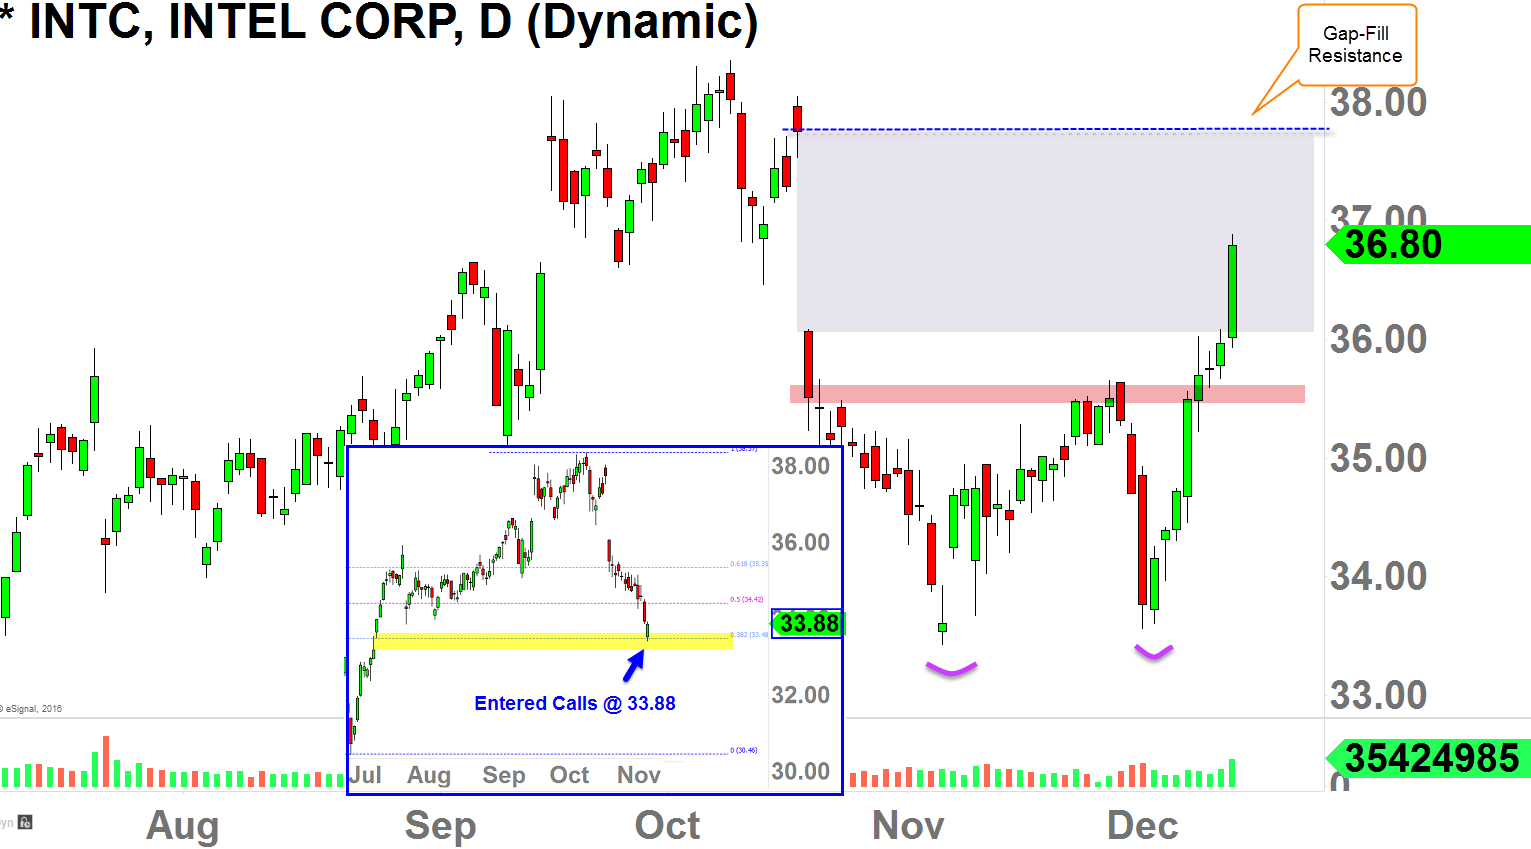
INTC Daily Chart

I traded my analysis, so I got long with calls (LEAPS) at 33.88, back on November 4th of this year.

This was the last level of my Fib. retracement zone, which, I came to the conclusion that the level might be acting as strong support.

Well, it did, by forming double-bottom reversal, as you can see in the chart above.

I had to be patient for about a month, but it's playing out nicely as the stock is now trading at 36.80 as of today.

My next minor term target is at 38-ish "gap-fill resistance" which I may unload some positions there.

I will write follow-up articles on INTC as we continue to be on watch for ATH target at 70ish.

3rd party Ad. Not an offer or recommendation by Investing.com. See disclosure here or remove ads .

Latest comments

Risk Disclosure: Trading in financial instruments and/or cryptocurrencies involves high risks including the risk of losing some, or all, of your investment amount, and may not be suitable for all investors. Prices of cryptocurrencies are extremely volatile and may be affected by external factors such as financial, regulatory or political events. Trading on margin increases the financial risks.
Before deciding to trade in financial instrument or cryptocurrencies you should be fully informed of the risks and costs associated with trading the financial markets, carefully consider your investment objectives, level of experience, and risk appetite, and seek professional advice where needed.
Fusion Media would like to remind you that the data contained in this website is not necessarily real-time nor accurate. The data and prices on the website are not necessarily provided by any market or exchange, but may be provided by market makers, and so prices may not be accurate and may differ from the actual price at any given market, meaning prices are indicative and not appropriate for trading purposes. Fusion Media and any provider of the data contained in this website will not accept liability for any loss or damage as a result of your trading, or your reliance on the information contained within this website.
It is prohibited to use, store, reproduce, display, modify, transmit or distribute the data contained in this website without the explicit prior written permission of Fusion Media and/or the data provider. All intellectual property rights are reserved by the providers and/or the exchange providing the data contained in this website.
Fusion Media may be compensated by the advertisers that appear on the website, based on your interaction with the advertisements or advertisers.
© 2007-2024 - Fusion Media Limited. All Rights Reserved.