Get 40% Off
👀 👁 🧿 All eyes on Biogen, up +4,56% after posting earnings. Our AI picked it in March 2024.
Which stocks will surge next?
Unlock AI-picked Stocks

INTC: Hot Stock To Own

Published 05/23/2018, 10:25 PM
Updated 07/09/2023, 06:31 AM

Intel Corporation (NASDAQ:INTC): LONG TERM


I remember the monthly chart (click here to see the chart--from the PART 3) I charted when it was just trading at mid 30s just about 10 months ago--this chart was showing uptrend development when the stock was preparing to breakout of the 17-year base. You see, with little bit of patience, INTC is now trading at 55s in less than a year. It has broken out of the 17-year base in October of 2017, and it never looked back since then. My ultimate target on INTC is still well-above the all-time high, and it looks like it is making a good progress so far.
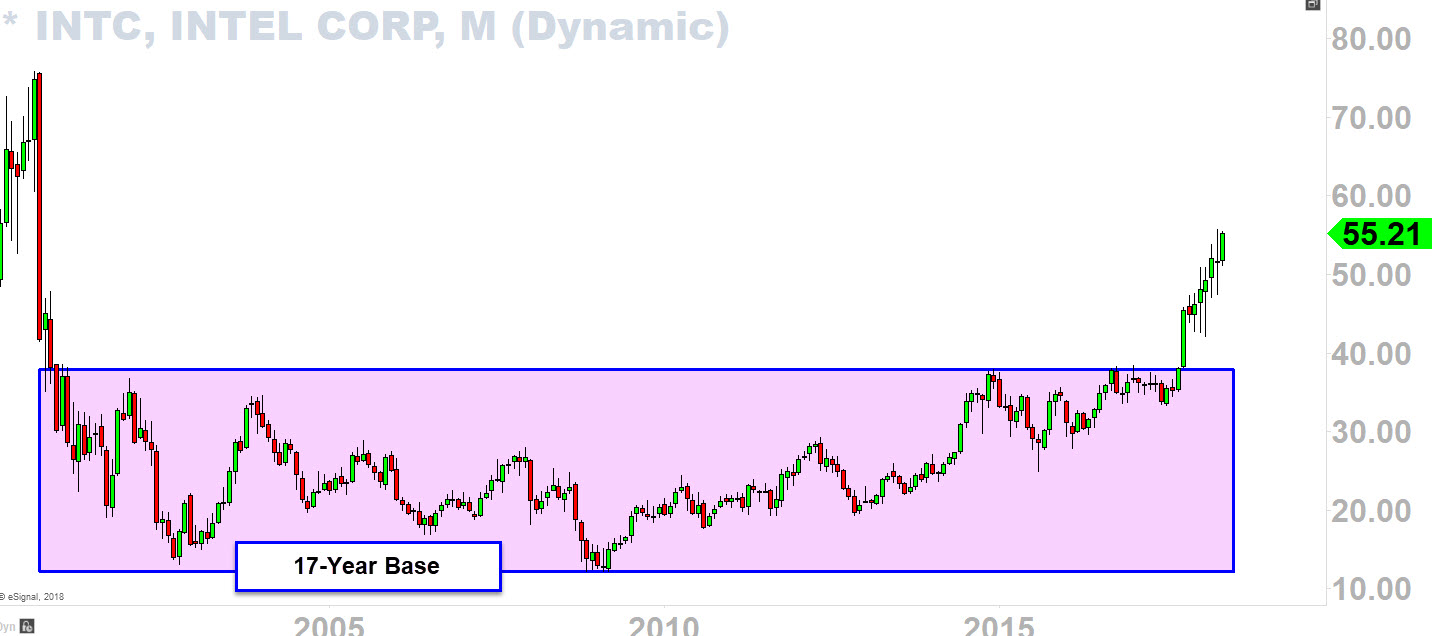
INTC Monthly Chart

UPTREND


This is important level that the bulls have protected (see arrows) when the 'shenanigan' happened back in the February of this year. so that the uptrend could be alive and thrive. Higher highs and higher lows is what you want to see in the long-term uptrend to be valid and healthy. Looking at things in the long term, I would have to say that the trend is well and healthy and valid.
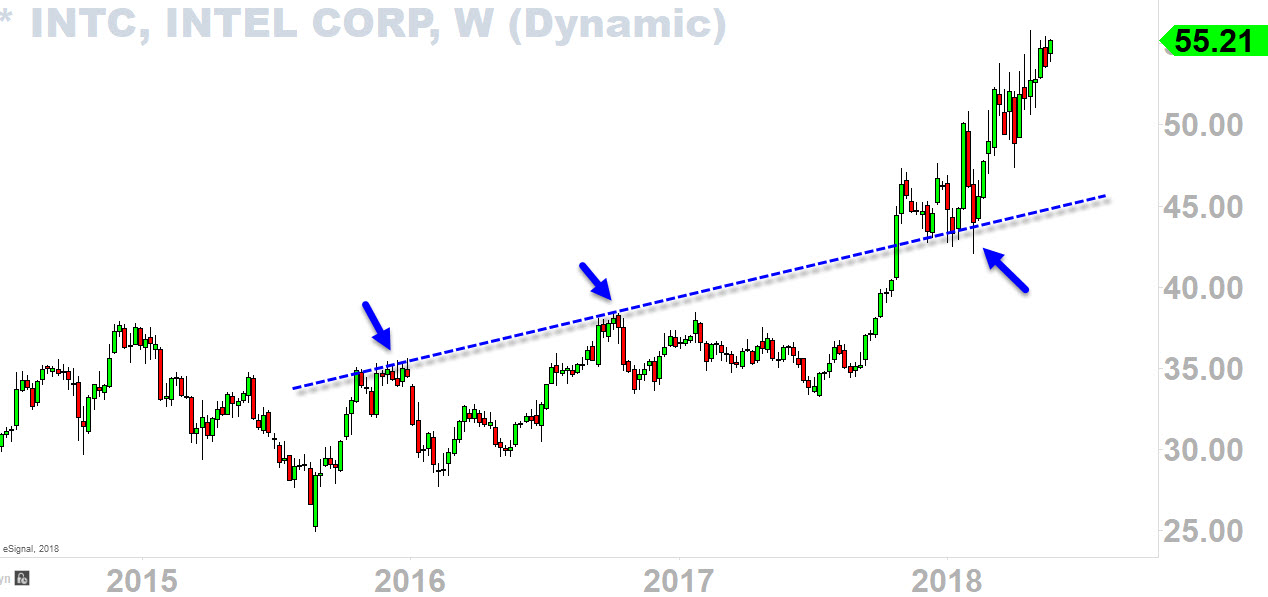
INTC Weekly Chart

RISING WEDGE


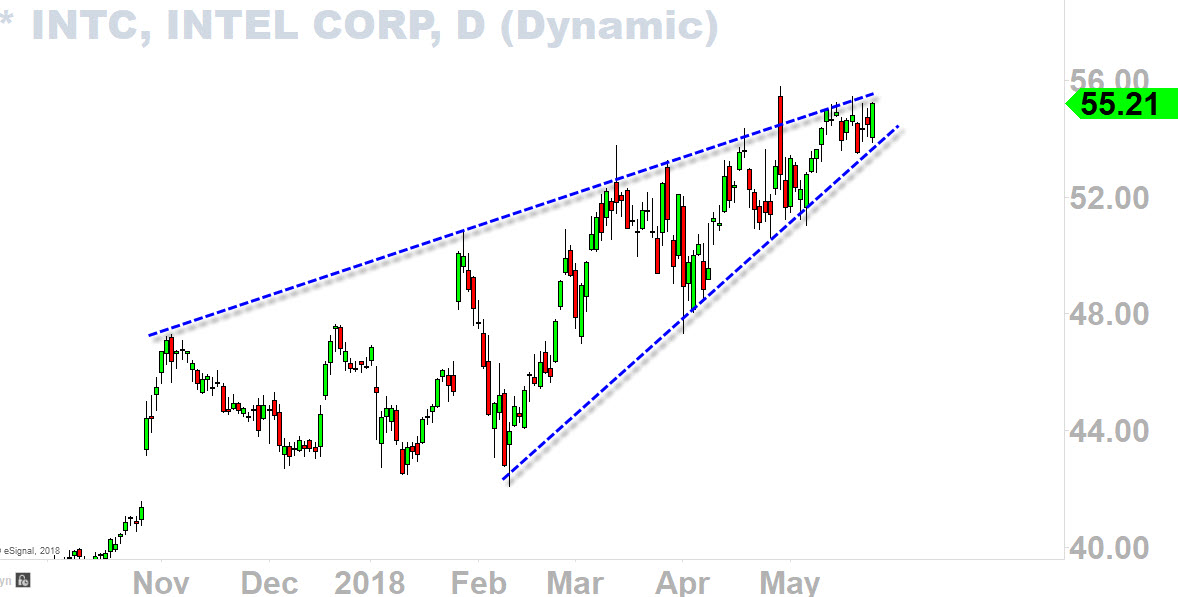
Things get hectic when we zoom in here as you can see the rising wedge formation. This formation (rising wedge) is actually categorized as a 'bearish reversal' pattern (I have no idea who are the people making the rules), but I have to say it's actually NOT bearish when you are dealing with a strong uptrend like we are seeing in this stock. This does not mean it is not going to break to the downside, this means, even if it breaks to the downside there is a good chance it will find support and continue higher (thus cultivating another intermediate-term higher low). If it breaks down, I am looking for 50-49ish level as strong support; but if it breaks higher, we may continue to 60 and 65s. Keep in mind, these consolidation patterns such as rising wedge always gets tricky with so many head fakes. So, trying to time the breakout/breakdown could be a very difficult proposition--this is the main reason of why I haven't added any new position on it since my last entry at 48.70 (1/26/2018)).
3rd party Ad. Not an offer or recommendation by Investing.com. See disclosure here or remove ads .

INTC Daily Chart

HOLDING STATUS


As of today, I am holding all of my SHARES (I haven't played any CALLS on it since I've closed all of them out back in November 2017--from PART 5)
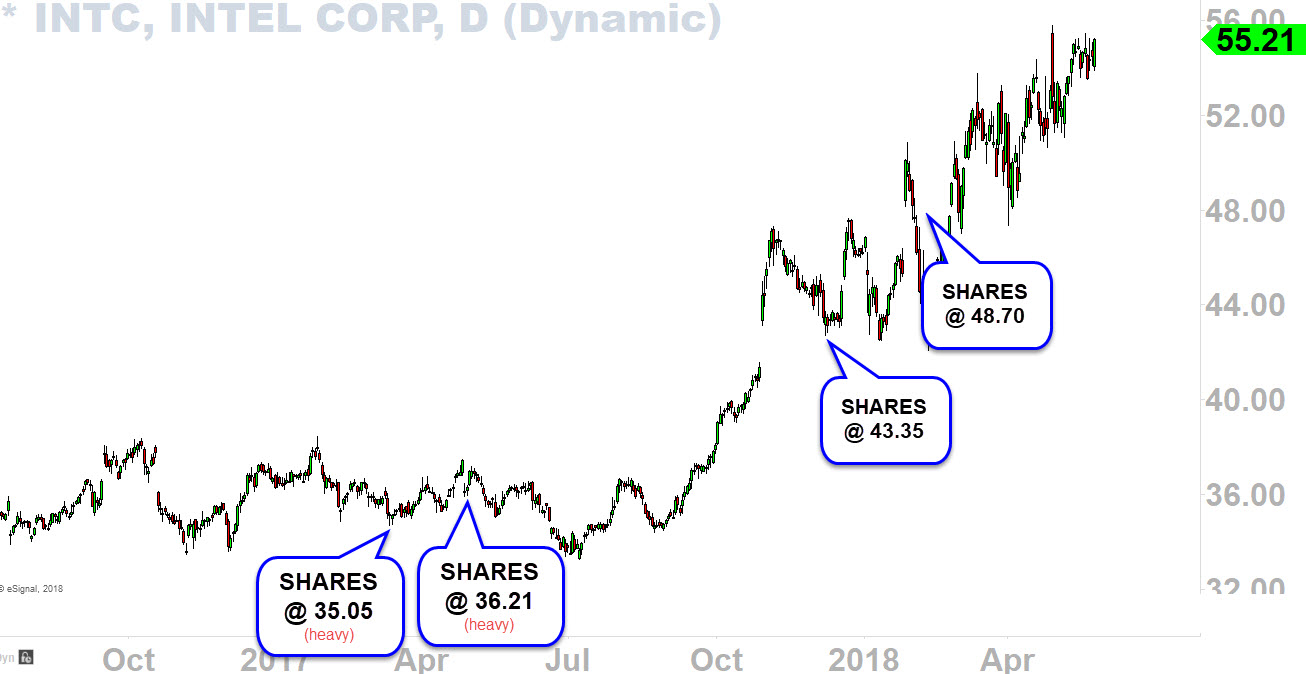
INTC Daily Chart
See original post: Click Here

Latest comments

Risk Disclosure: Trading in financial instruments and/or cryptocurrencies involves high risks including the risk of losing some, or all, of your investment amount, and may not be suitable for all investors. Prices of cryptocurrencies are extremely volatile and may be affected by external factors such as financial, regulatory or political events. Trading on margin increases the financial risks.
Before deciding to trade in financial instrument or cryptocurrencies you should be fully informed of the risks and costs associated with trading the financial markets, carefully consider your investment objectives, level of experience, and risk appetite, and seek professional advice where needed.
Fusion Media would like to remind you that the data contained in this website is not necessarily real-time nor accurate. The data and prices on the website are not necessarily provided by any market or exchange, but may be provided by market makers, and so prices may not be accurate and may differ from the actual price at any given market, meaning prices are indicative and not appropriate for trading purposes. Fusion Media and any provider of the data contained in this website will not accept liability for any loss or damage as a result of your trading, or your reliance on the information contained within this website.
It is prohibited to use, store, reproduce, display, modify, transmit or distribute the data contained in this website without the explicit prior written permission of Fusion Media and/or the data provider. All intellectual property rights are reserved by the providers and/or the exchange providing the data contained in this website.
Fusion Media may be compensated by the advertisers that appear on the website, based on your interaction with the advertisements or advertisers.
© 2007-2024 - Fusion Media Limited. All Rights Reserved.