
The US dollar continued sliding against most of its major peers, with most major equity indices trading in the green, as bond yields continued to slide. What may have calmed fears over high inflation is the US CPI data for February.
As for today, the ECB decides on monetary policy. Following the latest rally in bond yields, ECB officials sounded concerned and thus, it would be interesting to see whether they will signal more action soon.
Yields Continue To Retreat On Soft US Inflation Data
The US dollar continued trading lower against all but one of the other G10 currencies on Wednesday and during the Asian session Thursday. It lost the most ground versus NOK, Australian dollar, New Zealand dollar, and SEK in that order, while it was found virtually unchanged against CHF.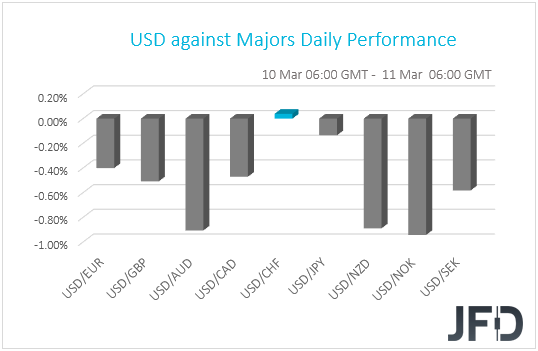
The weakening of the US dollar suggests that Treasury yields continued to pull back, which may have allowed stock indices to trade north. Indeed, turning our gaze to the equity world, we see that most major EU and US indices traded in the green, with the only exceptions being UK’s FTSE 100 and Wall Street’s NASDAQ. The positive appetite rolled over into the Asian session today as well.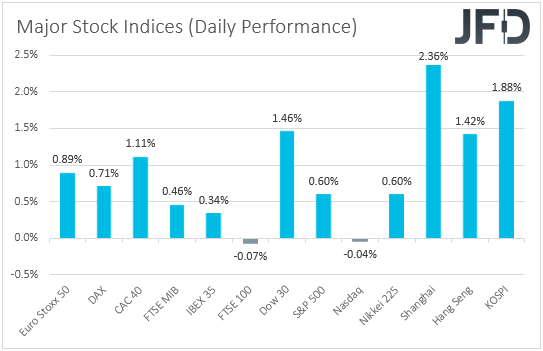
What may have calmed fears over high inflation is the US CPI data for February. Although the headline CPI rate rose to +1.7% yoy from +1.4% as expected, the core one ticked down to +1.3% yoy from +1.4%.
This adds more credence to the Fed’s view that it will take some time for inflation to rise and stay above 2% for some time. According to their projections, this is expected to happen in the years after 2023. It also validates our view that the recent retreat in equities due to higher yields was just a corrective phase, and that they were likely to rebound and continue trending north.
Apart from the US CPIs, we also had a BoC interest rate decision yesterday. The Bank kept its monetary policy settings unchanged and noted that the economic recovery continues to require extraordinary monetary policy support, until economic slack is absorbed so that the 2% inflation goal is sustainably achieved.
According to the Bank’s January projections, this is not expected to happen until into 2023. The Canadian dollar slid somewhat at the time of the release, but was quick to recover those losses as officials reiterated that as they continue: “to gain confidence in the strength of the recovery, the pace of net purchases of Government of Canada bonds will be adjusted as required,” something that may have kept the door for a QE tapering open.
FTSE 100 – Technical Outlook
The FTSE 100 index continues to trade above a short-term tentative upside support line taken from the low of Feb. 26. Another positive aspect is that the price remains above all of its EMAs. As long as the index stays above all the EMAs and that upside support line, we will continue aiming higher.
A push above the 6747 barrier, marked by yesterday’s high, may allow FTSE 100 to drift higher, towards the 6768 obstacle, or to the 6799 zone, marked by the highest point of February, where the index could stall. The price might even retrace back down a bit, but if it remains somewhere above the 6747 hurdle, another push higher could be possible.
If so, FTSE 100 might travel to the 6799 area again, a break of which would confirm a forthcoming higher high and then the index may rise to the 6820 level, marked by the high of Jan. 12, 2020.
Alternatively, if the price breaks the aforementioned upside line and then falls below the 6612 zone, marked by the low of Mar. 8, that could clear the way to some lower areas, as more bears might join in.
The index would already be placed below all of its EMAs, this way increasing the chances for a further drift south. The price could end up testing the 6552 territory, marked by the low of Mar. 5, which, if breaks, may set the stage for a move to the 6517 level. That level marks an intraday swing high of Feb. 26 and the current lowest point of March.
Will The ECB Signal More Easing?
As for today, the central torch will be passed to the ECB. Despite the lockdown measures around the Eurozone, at the press conference following the latest ECB meeting, President Christine Lagarde said that the downside risks to the economic outlook are now “less pronounced”, making investors skeptical over further easing.
However, following the latest rally in bond yields, ECB officials have been worried, noting that the rise has been “unwarranted” as the Eurozone’s economic recovery is still fragile and the vaccination process has been much slower than in the UK and the US.
Rising bond yields in Europe have partly spilled over from US markets reacting to US President Joseph Biden’s massive fiscal stimulus. Therefore, it would be interesting to see whether the ECB will turn dovish again, perhaps signaling that more easing may be required soon, or whether they will just say that the situation is worth monitoring closely.
EUR/JPY – Technical Outlook
This morning, EUR/JPY popped higher and broke above the 129.63 barrier, which was the previous highest point of March. The pair continues to trade above its short-term upside support line taken from the low of Feb. 4. For now, we will stay positive with the near-term outlook and aim for slightly higher areas.
A further push north could bring the rate to its next important resistance area, at 129.97, marked by the highest point of February, which might provide a temporary hold-up. The pair may even retrace slightly lower, however, if it continues to balance above the 129.63 hurdle, another push higher could be possible.
If the rate makes its way up again, and this time breaks the 129.97 obstacle, this will confirm a forthcoming higher high, potentially clearing the path to the 130.50 zone, marked by the highs of Oct. 10 and 12, 2018.
On the other hand, if the rate breaks the aforementioned upside line and falls below the 129.03 hurdle, marked by yesterday’s low, that may change the direction of the current trend, possibly inviting more bears into the game. EUR/JPY might drift to the 128.77 obstacle, a break of which may lead the pair to the 128.18 level, which is marked by the current lowest point of March.

As For The Rest Of Today's Events
The only release worth mentioning on today’s agenda is the US initial jobless claims for last week, which are expected to have declined to 725k from 745k the week before.
As for the speakers, besides ECB President Lagarde, who will hold a press conference after her Bank’s decision, we have one more official stepping up to the rostrum and this is BoC Governing Council member Lawrence Schembri.