India's 10-Year govt. bond price and Indian rupee are showing sign of fiscal distress in Government account.
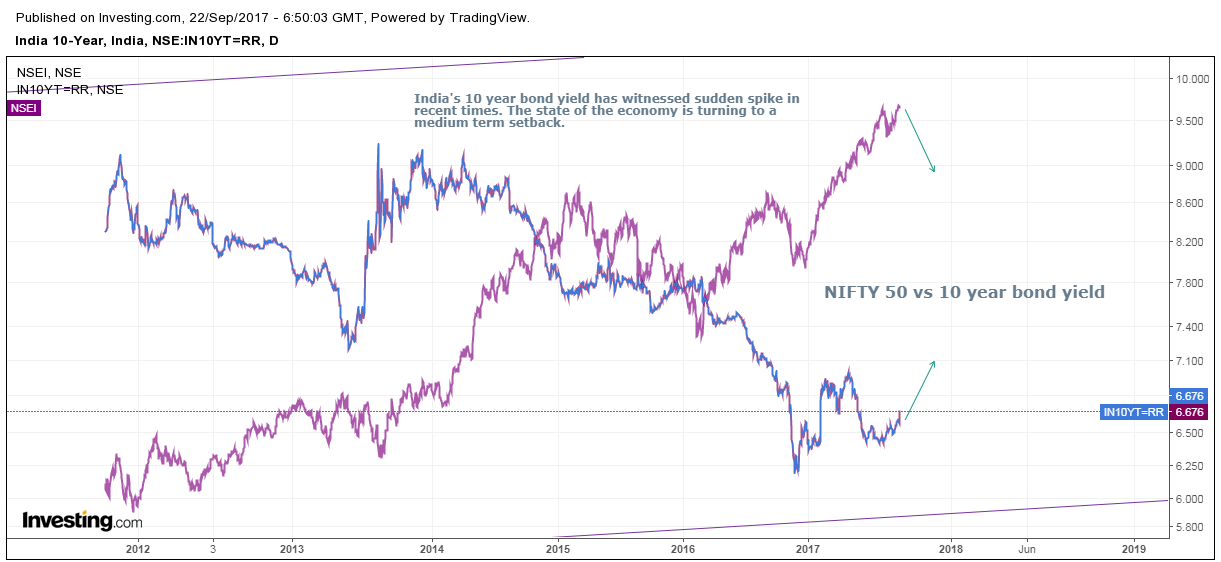
India's 10-year bond yield has witnessed a sudden spike. In early August 2017 the yield on 10-years G-SEC was around 6.37 and now it is trading around 6.68. An almost 30-basis-point rise in just a month tells us that something is not going right in the economic front.
Back in 2013 India's 10-year bond yield was around 9 per cent. Since August 2013, it has taken a dive toward 6.21 since December 2016. If we consider a low in December 2016 of 6.21 then we have already seen yield has risen to 7 percent by April 2017 and eased toward 6.37 through last month of this year. Again, we have seen yields rising in the last month. This rising tendency suggest that it may surpass 7 percent mark, which was made in April 2017.
There are several reasons behind the sudden rise in India's 10-year government bond, which are highlighted below. India’s fiscal deficit reached 92 percent of the budget estimate in the first four months of the financial year that began April 1, according to the Controller General of Accounts. Can government manage with rest of 8 percent and keep its fiscal deficit target at 3.2 per cent of the GDP? It seems difficult as India's GDP took a hit by demonetization last year and poor implementation of GST may further dampen GDP growth for the next couple of quarters. It is almost impossible for government to manage its fiscal deficit target of 3.2 percent of the GPD and bond traders are discounting that scenario. Moreover, concerns about India’s public finances heightened as the ET Now television channel wrote in Twitter posts that the government was weighing a stimulus package of 400 billion rupees ($6.2 billion). A spokesperson of the Ministry of Finance has said that no decision has been taken so far on the stimulus. But, there is increasing pressure on government to stimulate the economy as India's GDP growth has shown sign of weakness.
Bond Prices and INR
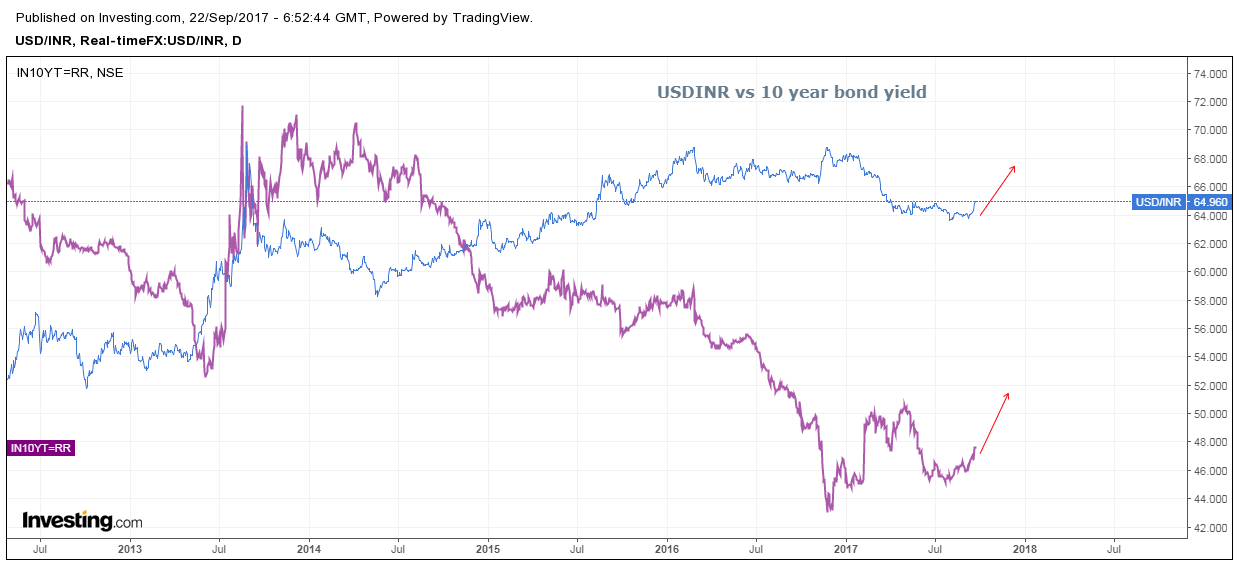
USD/INR is also showing similar signs of rise as currency traders are worried about fiscal management. The currency pair was trading around 63.50 just one month back and now has reached 65. This 2 percent depreciation in Indian currency in just two months also highlight the fact that there is serious concern about the fiscal discipline of the government and faltering economic growth.
Effect On Indian Equities
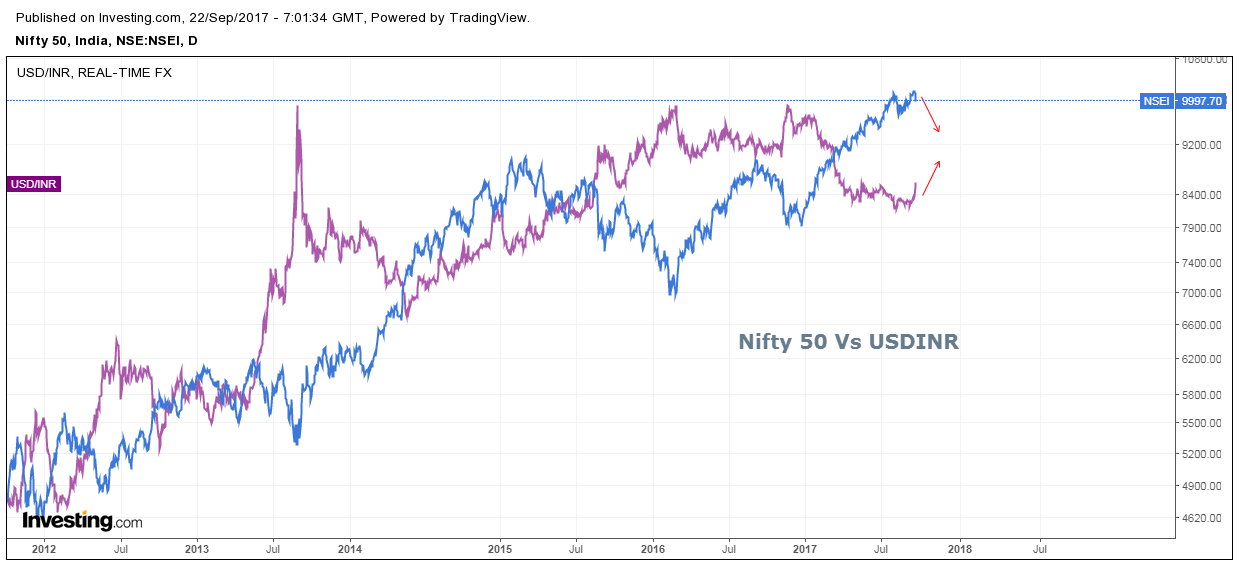
There is short-term inverse correlation between USD/INR and the Nifty 50, as seen in the chart above. This suggests that short-term setback in the Indian economy is clearly visible and we can see that effect in Indian equities too. If it is not addressed on time, it could dampen growth in the medium to long run as well.


