Get 40% Off
🚨 Volatile Markets? Find Hidden Gems for Serious OutperformanceFind Stocks Now

Glittering Global Indices Indicate Eruption Of Crash

Published 11/10/2017, 11:14 AM
Updated 07/09/2023, 06:31 AM


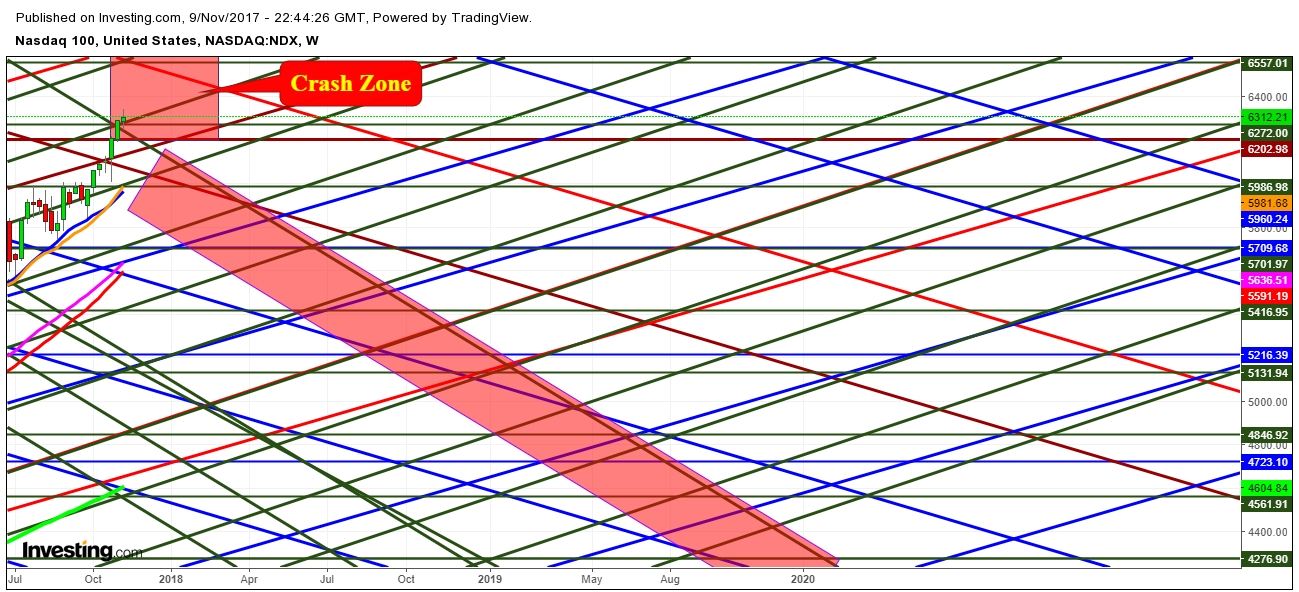
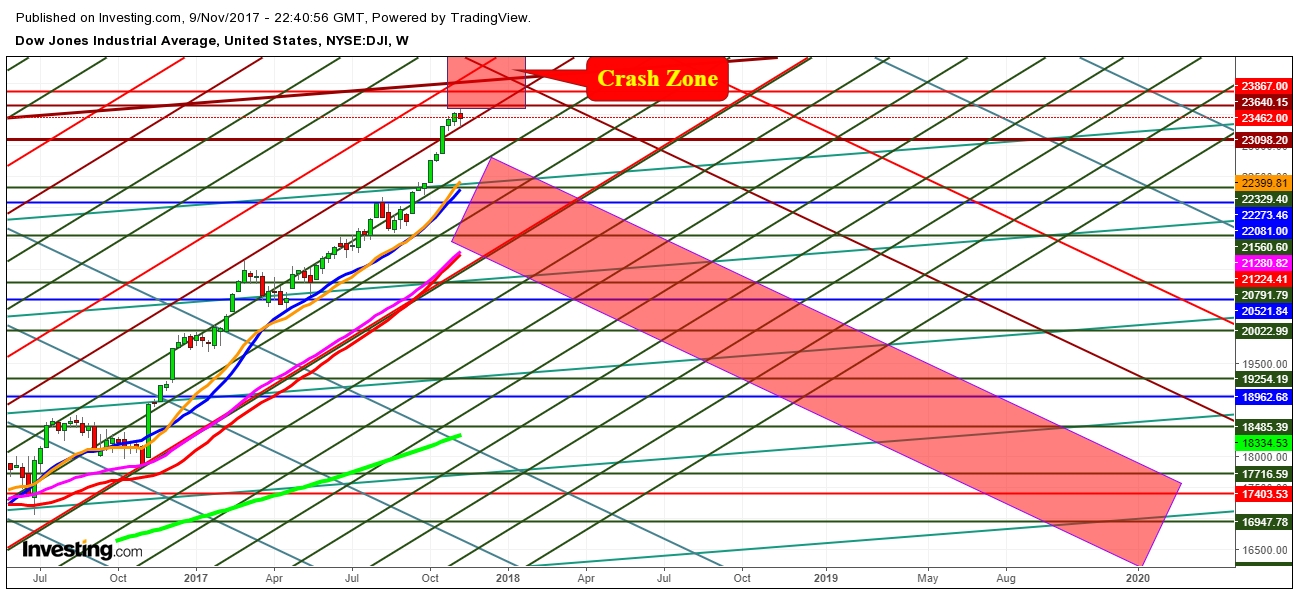
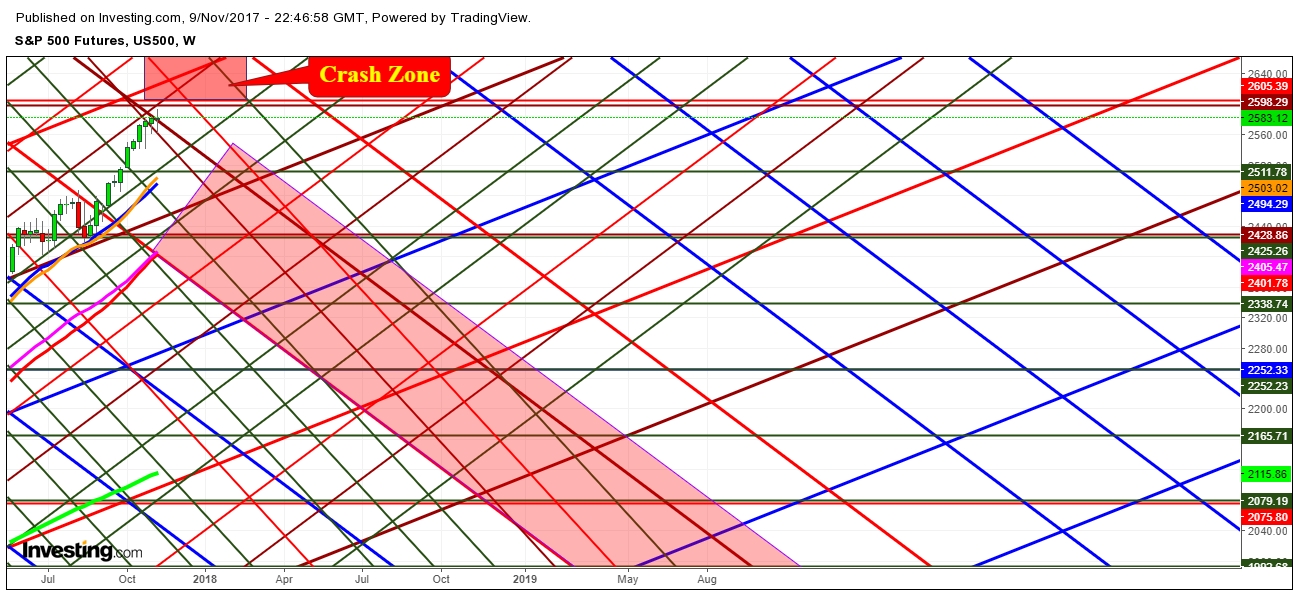
As I noted in my last analysis, which hardly be able to attract readers, at the time of swelling global indices all around. I tried my best not only to explain the possible technical indications in the weekly charts but also tried to explain the basic phenomena that every market crash occurs skeptically at the time when majority of the investors or traders feel too busy to joy the rides of market swings. Secondly, most of the World’s Indices are heading for a voyage towards a Crash Zone and seem to be waiting for an excuse to bust a bubble, before economic erosion.

On analysis of the geo-political scenario on November 9th, 2017, I find the eruption of too many such excuses have started to glow their reflection upon the movement of major global indices during the last few days from Saudi Arabia’s anti-corruption purge to U.S. President Mr. Trump’s latest statement on North Korea.

On analysis of the movement of major U.S. Indices : S&P 500, Nasdaq and Dow Jones 30 futures, I find an emergence of an important fluctuation signal in the Weekly Charts, which has always been an advance signal before every market crash historically. Secondly, having a re look at the same weekly chart patterns which I noted in my last analysis makes my thoughts to ponder around the probabilities of a market crash very soon, most probably from November 13th, 2017 to February 22nd, 2018. No one knows which excuse the upcoming market crash would prefer to take first. But, once thing is definite and that is the sliding tremors of the crash will continue to be felt at least till one year after the crash. Best advice is to sit with cash till the nice opportunity comes for long time investment.

3rd party Ad. Not an offer or recommendation by Investing.com. See disclosure here or remove ads .

S&P 500 Weekly Chart

Nasdaq  Weekly Chart

Dow Jones Weekly Chart

Disclosure: This content is for information and educational purposes only and should not be considered as an investment advice or an investment recommendation. Past performance is not an indication of future results. All trading carries risk. Only risk capital be involved which you are prepared to lose.

Latest comments

Risk Disclosure: Trading in financial instruments and/or cryptocurrencies involves high risks including the risk of losing some, or all, of your investment amount, and may not be suitable for all investors. Prices of cryptocurrencies are extremely volatile and may be affected by external factors such as financial, regulatory or political events. Trading on margin increases the financial risks.
Before deciding to trade in financial instrument or cryptocurrencies you should be fully informed of the risks and costs associated with trading the financial markets, carefully consider your investment objectives, level of experience, and risk appetite, and seek professional advice where needed.
Fusion Media would like to remind you that the data contained in this website is not necessarily real-time nor accurate. The data and prices on the website are not necessarily provided by any market or exchange, but may be provided by market makers, and so prices may not be accurate and may differ from the actual price at any given market, meaning prices are indicative and not appropriate for trading purposes. Fusion Media and any provider of the data contained in this website will not accept liability for any loss or damage as a result of your trading, or your reliance on the information contained within this website.
It is prohibited to use, store, reproduce, display, modify, transmit or distribute the data contained in this website without the explicit prior written permission of Fusion Media and/or the data provider. All intellectual property rights are reserved by the providers and/or the exchange providing the data contained in this website.
Fusion Media may be compensated by the advertisers that appear on the website, based on your interaction with the advertisements or advertisers.
© 2007-2024 - Fusion Media Limited. All Rights Reserved.