GBP/JPY Weekly Outlook
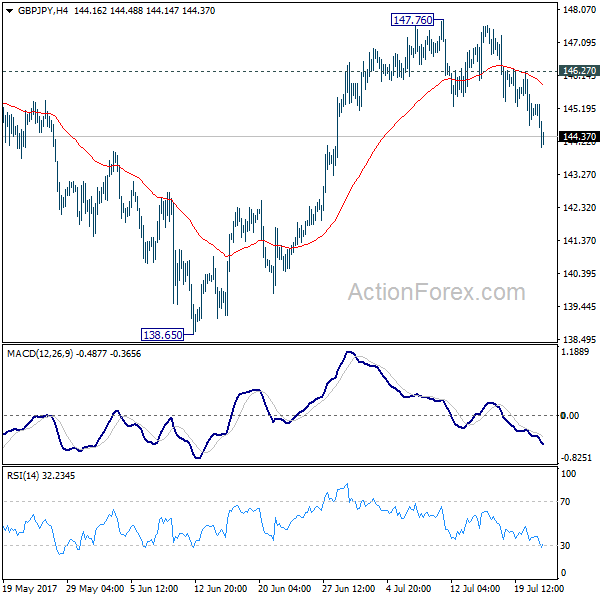
GBP/JPY's decline and break of 145.25 support last week clear up the outlook. Rise from 1.3865 should have completed at 147.76 after failing 148.09/42 resistance zone. Initial bias stays on the downside this week. Sustained trading below 55 day EMA (now at 144.04) will target 138.65 support and below. But we'd expect strong support from 135.58 to contain downside and bring rebound. On the upside, above 146.27 minor resistance will turn bias back to the upside for 147.76 instead.
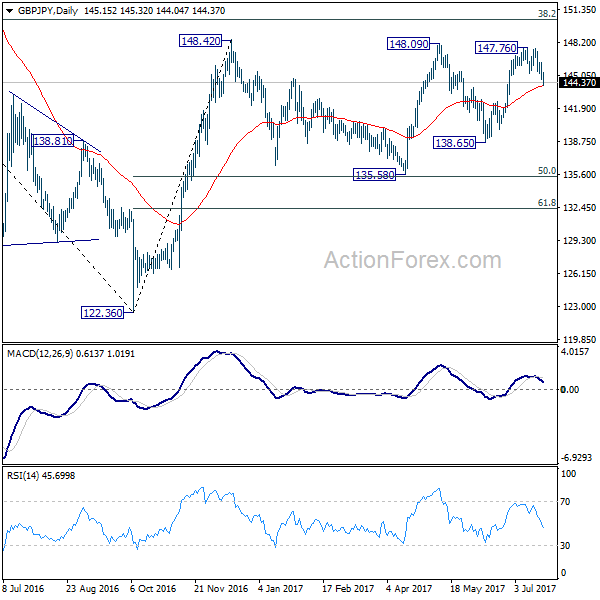
In the bigger picture, rise from medium term bottom at 122.36 is expected to continue to 38.2% retracement of 196.85 to 122.36 at 150.43. Decisive break there will carry long term bullish implications and pave the way to 61.8% retracement at 167.78. In case the sideway pattern from 148.42 extends, we'd be looking for strong support from 135.58 and 50% retracement of 122.36 to 148.42 at 135.39 to contain downside.
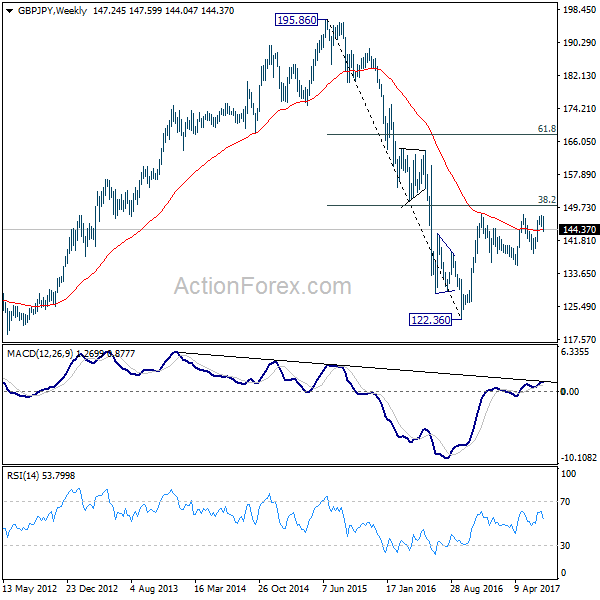
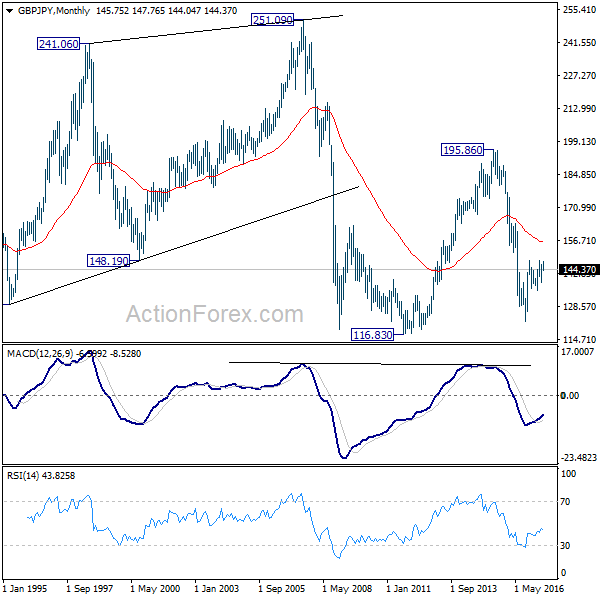
In the longer term picture, it remains to be confirmed is whole down trend from 195.86 has completed at 122.36 already and there is no confirmation yet. But in any case, firm break of 38.2% retracement of 195.86 to 122.36 at 150.43 would pave the way to 61.8% retracement at 167.78. And with that, the 55 month EMA will be firmly taken out which suggests that price actions from 116.83 is indeed a sideway pattern that could last more than a decade.
EUR/JPY Weekly Outlook
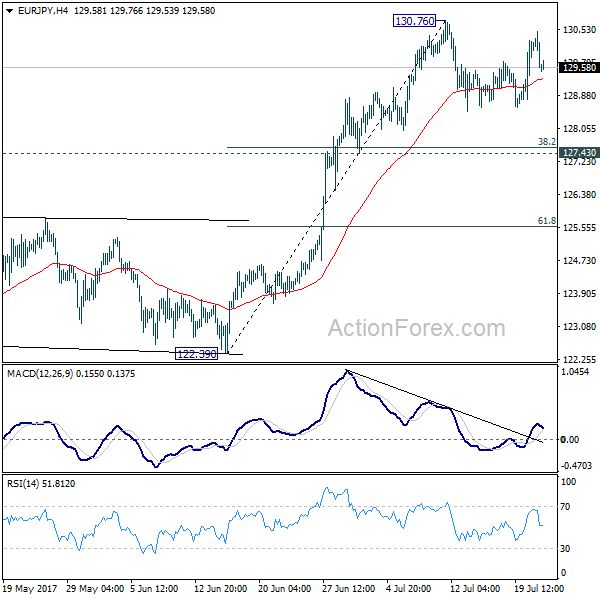
EUR/JPY continued to engage in consolidation below 130.76 last week and outlook is unchanged. Initial bias remains neutral this week first. In case of another fall, downside should be contained by 127.43 cluster support (38.2% retracement of 122.39 to 130.76 at 127.56) and bring rebound. Above 130.76 will extend the larger rally to next key fibonacci level at 134.20.
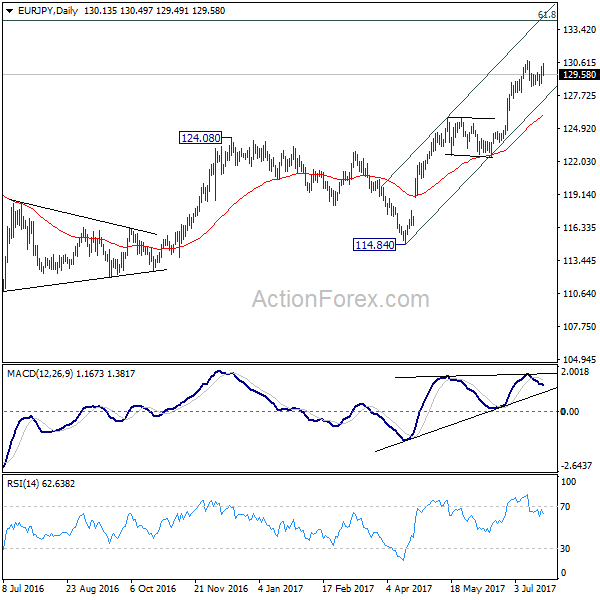
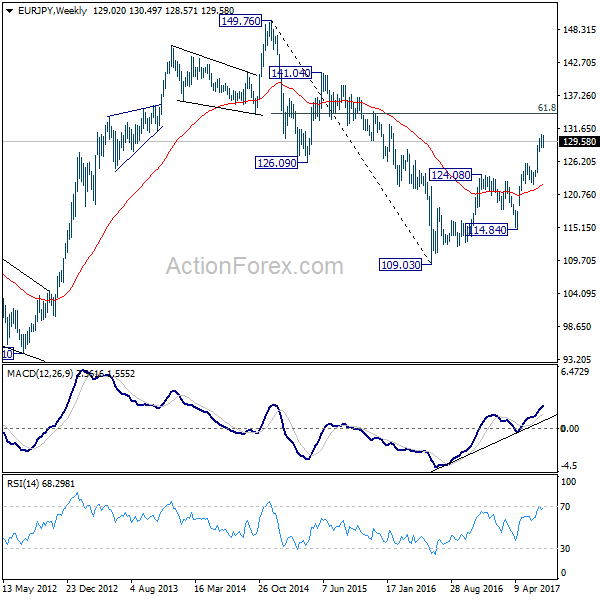
In the bigger picture, the down trend from 149.76 (2014 high) is completed at 109.03 (2016 low). Current rally from 109.03 should be at the same degree as the fall from 149.76 to 109.03. Further rise is expected to 61.8% retracement of 149.76 to 109.03 at 134.20. Sustained break there will pave the way to key long term resistance zone at 141.04/149.76. Medium term outlook will remain bullish as long as 124.08 resistance turned support holds.
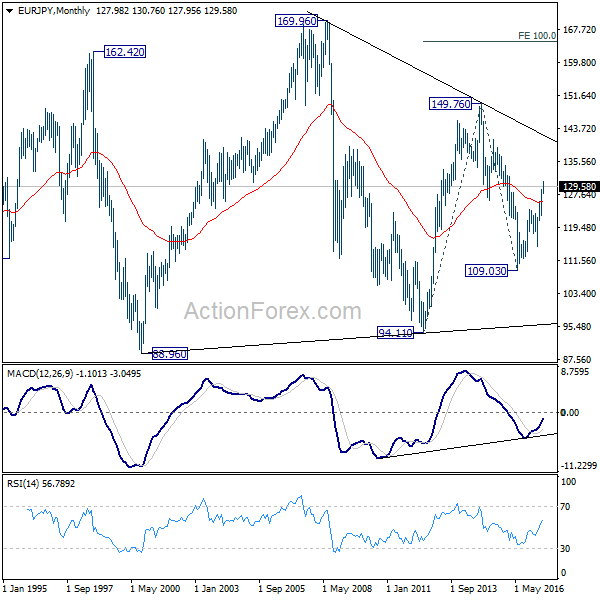
In the long term picture, at this point, there is no clear indication that rise from 109.03 is resuming that from 94.11. Hence, we'd be cautious on topping below 149.76 to extend range trading. Nonetheless, firm break of 149.76 will indicates strong underlying buying. In such case, EUR/JPY will target 100% projection of 94.11 to 149.76 from 109.03 at 164.68.