The dollar fell from previous highs against most major currencies on Wednesday, as Janet Yellen’s remarks to congress signalled a “gradual” tightening in interest rates, revealing that the Federal Reserve remains cautious in moving forward with raising rates amid a slowdown in inflation.
Further pressure on the dollar came after a rise in the Canadian dollar, when the Bank of Canada increased rates from 0.5% to 0.75% for first time in seven years.
It was the first rate increase by the BoC in nearly seven years, making it the first major central bank to join the Fed in tightening monetary policy.
Today, the U.S. is to release data on producer prices and jobless claims while later in the day, Janet Yellen is to testify on the monetary policy report before the Senate Banking Committee, in Washington.
Later in the week, investors will be focusing on Friday’s inflation data for further clues on the timing of the next Fed rate hike.
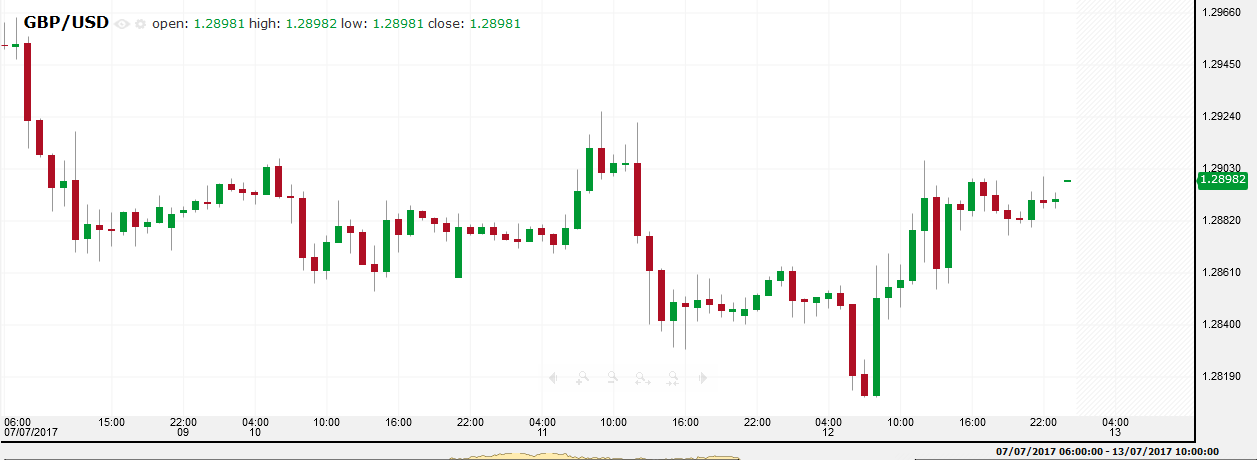
Sterling recovered from two-week lows on Wednesday, after the latest UK jobs report showed that the jobless rate fell to a 42-year low in the three months to May, but wage growth remained low behind inflation.
The pound weakened in early trade after Bank of England Deputy Governor Ben Broadbent said in an interview published on Wednesday that he is not ready to raise interest rates just yet.
The remarks indicated that the BoE is now almost certain to keep rates on hold at their current record lows at next month’s meeting.
In the spotlight for this week is Friday’s inflation data for further clues on the timing of the next Fed rate hike.

Pivot: 1.2855
Support: 1.2855 1.281 1.277
Resistance: 1.292 1.2945 1.2975
Scenario 1: long positions above 1.2855 with targets at 1.2920 & 1.2945 in extension.
Scenario 2: below 1.2855 look for further downside with 1.2810 & 1.2770 as targets.
Comment: the RSI lacks downward momentum.
Gold
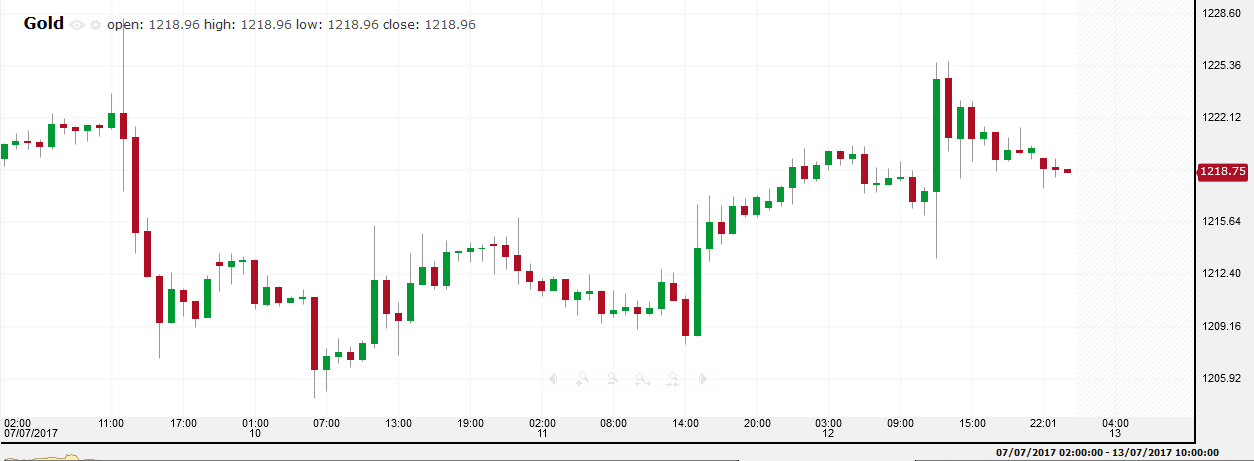
Gold prices recovered from four-month lows reached on Monday, after Federal Reserve chair Janet Yellen’s testimony to congress revealed that the central bank does not have to lift rates significantly to reach the neutral fed funds rate, pointing to a slower pace of future rate hikes.
The statement from Yellen pressured the dollar, boosting demand for the precious metal which traded above $1220 later in the U.S. session.
Today, the U.S. is to release data on producer prices and jobless claims while Friday’s inflation data will be in the spotlight for further clues on the timing of the next Fed rate hike.

Pivot: 1213
Support: 1213 1208 1205
Resistance: 1226 1229 1233
Scenario 1: long positions above 1213.00 with targets at 1226.00 & 1229.00 in extension.
Scenario 2: below 1213.00 look for further downside with 1208.00 & 1205.00 as targets.
Comment: the RSI is mixed to bullish.
WTI Oil
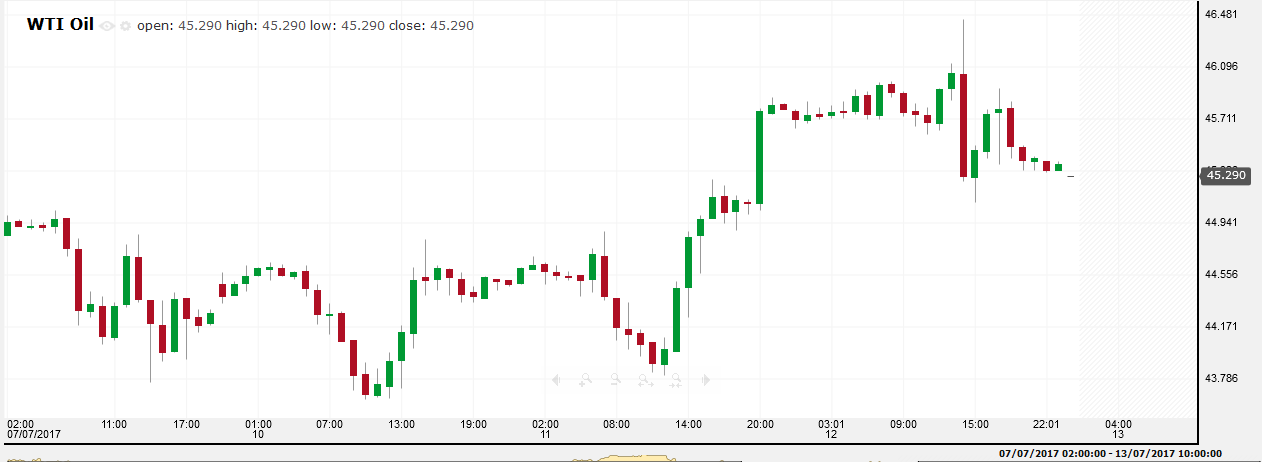
Oil prices posted a slight drop on Wednesday despite the fact that US inventories fell more than expected in the latest week.
The Energy Information Administration said inventories fell by 7.564 million barrels much lower than the expected drop of 2.850 million barrels.
Gasoline inventories fell by 1.647 million barrels when they were forecast to rise by 1.147 million barrels.
Meanwhile, OPEC said on Wednesday its oil production jumped in June and forecast world demand for its crude will decline next year.

Pivot: 45.1
Support: 45.1 44.85 44.3
Resistance: 46.15 46.5 46.9
Scenario 1: long positions above 45.10 with targets at 46.15 & 46.50 in extension.
Scenario 2: below 45.10 look for further downside with 44.85 & 44.30 as targets.
Comment: a support base at 45.10 has formed and has allowed for a temporary stabilisation.
US 500
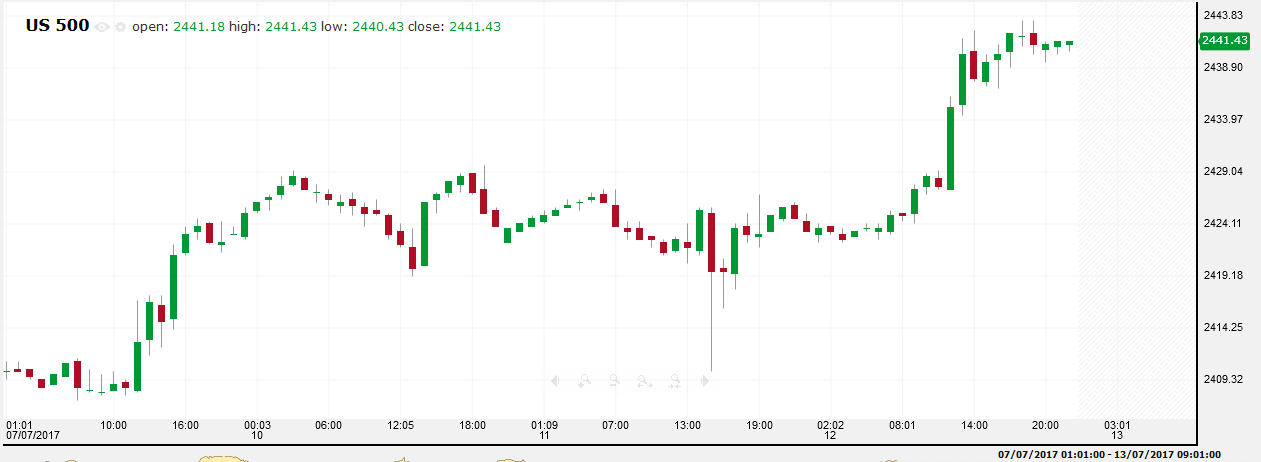
The main U.S. indexes ended higher on Wednesday, following Yellen’s testimony, which signaled that the Fed remains cautious due to low inflation, and it will gradually tighten policy and gradually unwind its massive balance sheet.
The rate-sensitive S&P 500 real estate index was among the strongest in the benchmark index, posting a 1.3 percent gain, its biggest one-day percentage gain in about four months. Technology shares also rose sharply, with the tech index also up 1.3 percent.
Yellen’s statement put the S&P 500 financials, which tend to benefit from higher rates, last among sectors, ending with just a gain of 0.1 percent.
Later in the week, investors will be focusing on Friday’s inflation data for further clues on the timing of the next Fed rate hike.

Pivot: 2430
Support: 2430 2419 2416
Resistance: 2451 2455 2460
Scenario 1: long positions above 2430.00 with targets at 2451.00 & 2455.00 in extension.
Scenario 2: below 2430.00 look for further downside with 2419.00 & 2416.00 as targets.
Comment: the RSI is bullish and calls for further upside.
